Essential Studies Assessment
The Essential Studies (ES) Program assessment process benefits from faculty assessment of course material in order to assess each ES learning goal.
Data is collected from faculty on one learning goal per semester based on the ES learning goal rubrics. Data is collected only from courses that are validated for that goal and are being offered during the semester indicated.
- Spring 2024 - Written Communication
- Spring 2025 - Critical Inquiry & Analysis
- Fall 2025 - Quantitative Reasoning
- Spring 2026 - Information Literacy
- Fall 2026 - Oral Communication
- Spring 2027 - Intercultural Knowledge & Skills
Essential Studies Assessment Training
Essential Studies Assessment Process
The resources below provide a brief overview of the Essential Studies (ES) process, including the ES learning goals, scoring rubric, and resources instructors can use to help with ES reporting.
The resources below explain how to enter Essential Studies (ES) data, including how to report data from multiple course sections, how to use the rubric, and how to enter "not applicable" data.
Demonstration Video: Essential Studies Data Entry
How-To: Essential Studies Data Entry
Rubrics
- ES Written Communication Rubric
- ES Oral Communication Rubric
- ES Quantitative Reasoning Rubric
- ES Information Literacy Rubric
- ES Intercultural Knowledge & Skills Rubric
- ES Critical Inquiry & Analysis
Data Summaries
We do not have data summaries from 2020 or 2021. We did not receive a summary from our VALUE Institute data submissions in 2020 and chose at that time to no longer submit work to them for our assessment purposes. We did not collect any data in 2021 as we were developing a new process that will result in data collection during Fall 2022.
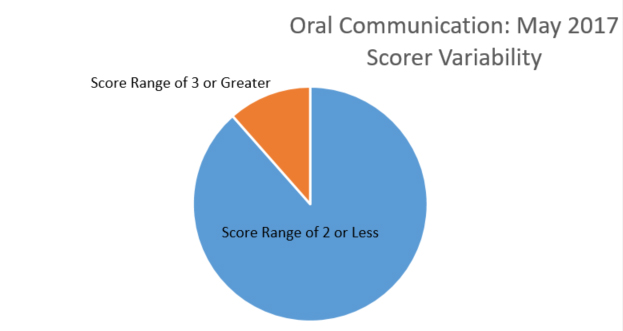
A total of 86 faculty and staff scorers interacted with approximately 350 students at the Spring 2017 UNDergraduate Showcase poster session.
Data quality considerations and assessment methodology:
- Pre-scoring “norming” process was used to achieve scorer consistency.
- Scorers were randomly assigned to interact with students to avoid systematic scoring biases.
- Scoring sample came from a subset of the total population of ES capstone students, and thus was not a true random sample.
- Only students scored by at least two independent scorers were considered for the final analysis.
- In the large majority of cases the spread between scorers’ results for the same student differed by 2 points or less (out of a maximum of 6).
Scorer Variability
Score range of two or less is significantly larger than score range of three or greater.
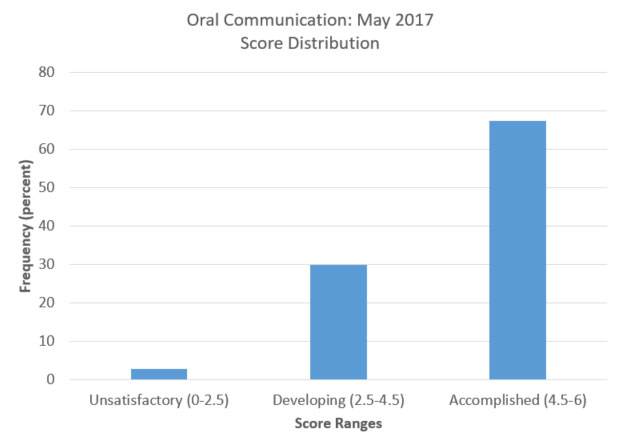
Score Distribution
Approximately 68 selected Accomplished (4.5-6).
For results with the highest-possible reliability and validity, we focus on the 836 scoring instances with a maximum scorer spread of 0 or 1:
- Oral Communication, May 2017: Scoring Results (Undergraduate Showcase and Brief Analysis)
Interpreting Results
These results suggest UND students’ oral communication abilities are rarely “unsatisfactory,” with more than 2/3 scoring as “accomplished.”
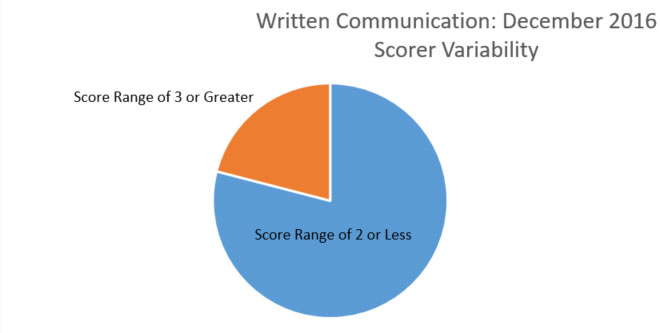
A total of 20 faculty and staff scored approximately 85 students’ written work from a performance task developed by UND faculty and which was focused on the ES Written Communication learning goal. Students completed their work during the February 2016 Assessment Week.
Data Quality Considerations and Assessment Methodology:
- Pre-scoring “norming” process was used to achieve scorer consistency.
- Scorers were randomly assigned to assess students’ work to avoid systematic scoring biases.
- Scoring sample came from a subset of the total population of ES capstone students, and thus was not a true random sample.
- Only students scored by at least two independent scorers were considered for the final analysis.
- In the large majority of cases the spread between scorers’ results for the same student differed by 2 points or less (out of a maximum of 6).
Scorer Variability
A significant amount selected Score Range of 2 or Less.
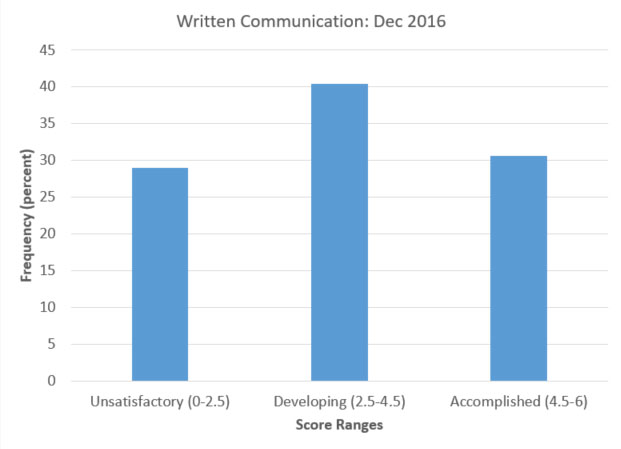
Results Summary
Majority selcted Developing (2.5-4.5)
- For results with the highest-possible validity, we focus on the 183 scoring instances of ES capstone students with a scorer spread of 0 or 1:
- Written Communication Scoring Session, December 2016:Scoring Results and Brief Analysis
Interpreting Results
There is clear room for improvement, as only approximately 30% of students produced work in the “accomplished” category.
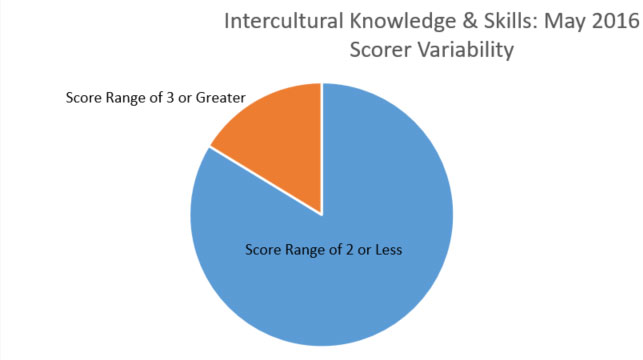
A total of 22 faculty and staff scored approximately 100 students’ written work from a performance task developed by UND faculty which was focused on the ES Diversity learning goal (this was the name and framework for the goal before being revised to become Intercultural Knowledge & Skills). Students completed their work during the February 2016 Assessment Week.
Data Quality Considerations and Assessment Methodology:
- Pre-scoring “norming” process was used to achieve scorer consistency.
- Scorers were randomly assigned to assess students’ work to avoid systematic scoring biases.
- Scoring sample came from a subset of the total population of ES capstone students, and thus was not a true random sample.
- Only students scored by at least two independent scorers were considered for the final analysis.
- In the large majority of cases the spread between scorer’s results for the same student differ by 2 points or less (out of a maximum spread of 6).
Scorer Variability
Majority selected Score Range of 2 or less.
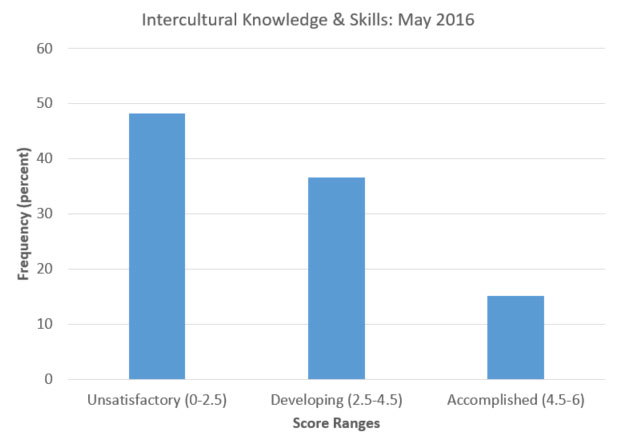
Results
Majority selected Unsatisfactory (0-2.5).
- For results with the highest possible validity, we focus on the 270 scoring instances of ES capstone students with a scorer spread of 0 or 1:
- Diversity Scoring Session, May 2016:Scoring Results and Brief Analysis
Interpreting Results
- These results were discouraging, as only approximately 15% of students produced work in the “accomplished” category, and almost a majority showed scores in the “unsatisfactory” category.
- Because of the key piece of evidence provided by these results, the ES requirements in this particular area have been revised, and involve strengthened course criteria and expectations.
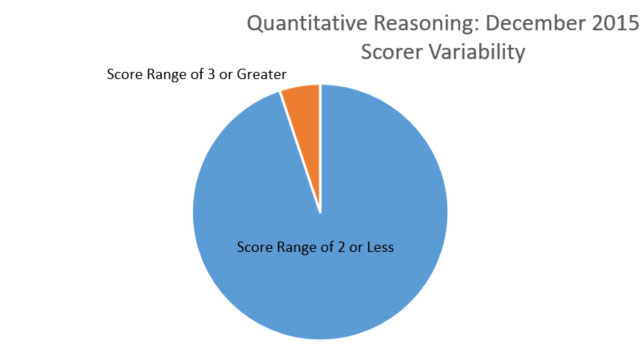
A total of 15 faculty and staff scored approximately 120 students’ written work from a performance task developed by UND faculty which was focused on the ES Quantitative Reasoning learning goal. Students completed their work during the February 2015 Assessment Week.
Data Quality Considerations and Assessment Methodology:
- Pre-scoring “norming” process was used to achieve scorer consistency.
- Scorers were randomly assigned to assess students’ work to avoid systematic scoring biases.
- Scoring sample came from a subset of the total population of ES capstone students, and thus was not a true random sample.
- Only students scored by at least two independent scorers were considered for the final analysis.
- In the large majority of cases the spread between scorer’s results for the same student differ by 2 points or less (out of a maximum spread of 6).
Scorer Variability
Majority selected Score Range of 2 or Less.
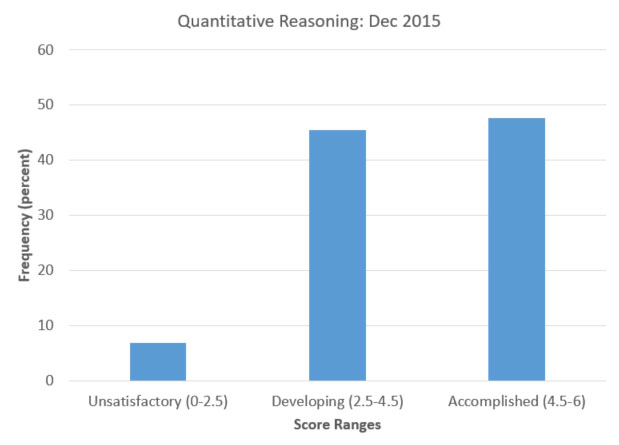
Results
Majority selected Accomplished (4.5-6).
- For results with the highest possible validity, we focus on the 363 scoring instances of ES capstone students with a scorer spread of 0 or 1:
- Quantitative Reasoning Scoring Session, December 2015: Scoring Results and Brief Analysis
Interpreting Results
- Roughly 45% of students scored in each of the “accomplished” and “developing” categories, indicating clear room for improvement.
- A previous instance of quantitative reasoning assessment showed a greater percentage of students in the “Unsatisfactory” and “Accomplished” categories. Thus there was both positive and negative progress made between the two assessment instances.
In February 2018, senior students (n=171) in ES Capstone courses volunteered to take a specially designed “performance task” that presented them with a scenario asking them to produce work focused on the ES Information Literacy (IL) learning goal. The task was designed by UND faculty members to determine the level of accomplishment of UND students relative to this aspect of the ES Program. The task was aligned with the Association of American Colleges & Universities’ VALUE rubric for IL. In May 2018, faculty and staff (n=28) participated in a “scoring session” in which they assessed the students’ work from February 2018. Below are summarized the results from the scoring session.
Majority selected Developing.
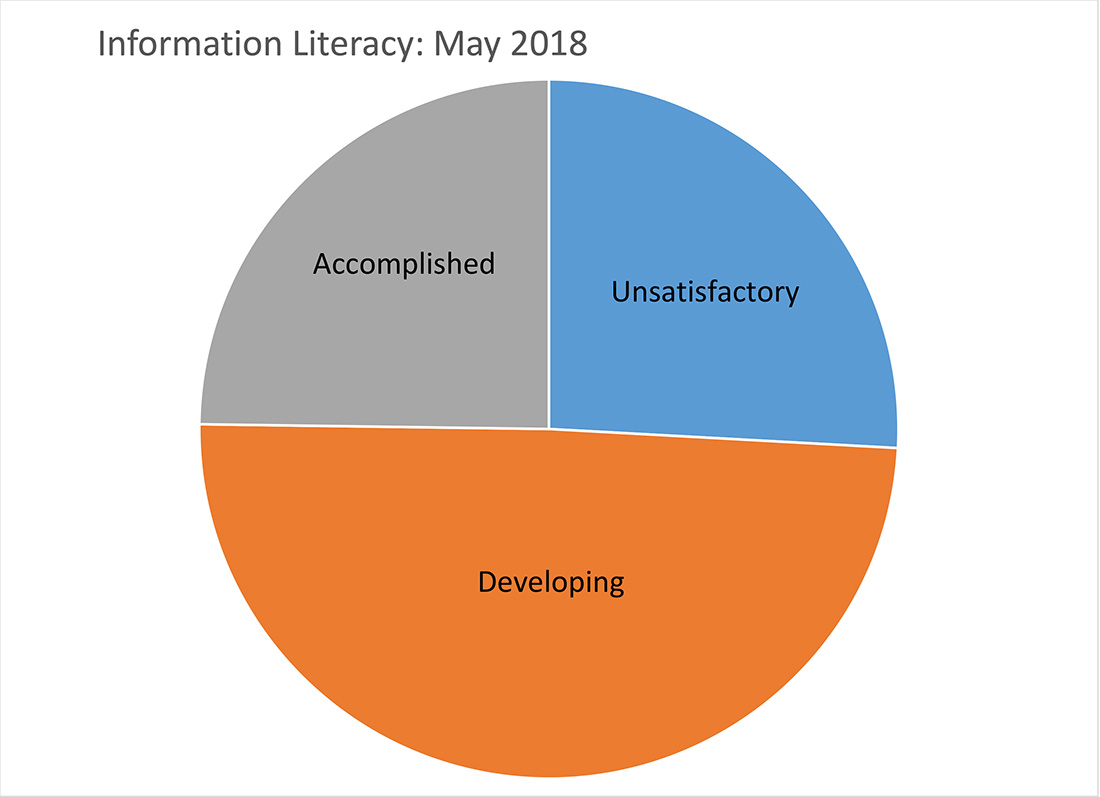
Data Summaries
Information Literacy: Scoring Results and Brief Analysis
In February 2017, senior students (n = 240) in ES Capstone courses volunteered to take a specially designed “performance task” that presented them with a scenario asking for them to produce work focused on the ES Critical Inquiry & Analysis learning goal. The task was designed by UND faculty members to determine the level of accomplishment of UND students relative to the ES CI&A learning goal. The task was aligned with both UND’s ES CI&A criteria and UND’s CI&A Assessment Rubric. In December 2017, faculty and academic staff (n = 28) participated in a “scoring session” in which they assessed the students’ work from February 2017. Below are summarized the results from the scoring session for the 195 student work products scored the requisite number of times (2 under most circumstances, 3 times when the first two scorings disagreed substantially).
Majority selected Score Range of 2 or Less.
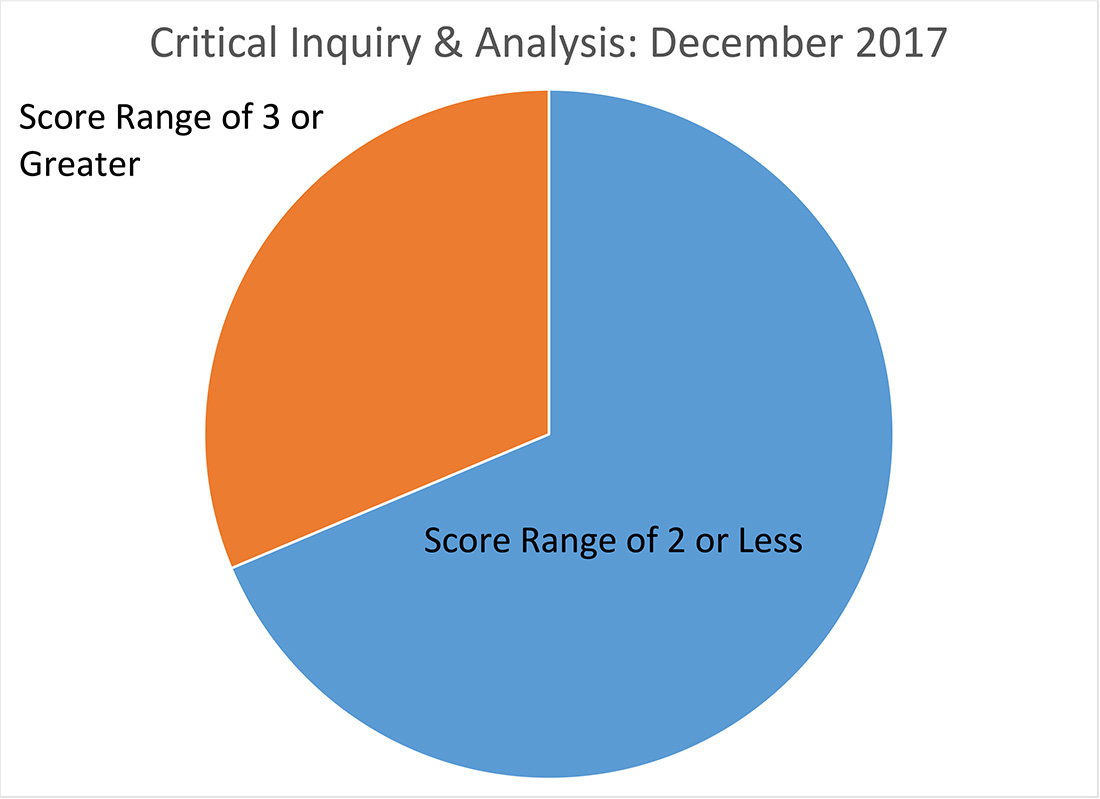
Data Summaries
Critical Thinking and Written Communication: Scoring Session Results/Report
Contact
For more information about the Essential Studies assessment process, contact:
Allyssa Baumbach
Senior Specialist of Assessment & Analytics