Essential Studies Assessment
The Essential Studies (ES) Program assessment process benefits from faculty assessment of course material in order to assess each ES learning goal.
Upcoming Goals and Timeline
Data is collected from faculty on one learning goal per semester based on the ES learning goal rubrics. Data is collected only from courses that are validated for that goal and are being offered during the semester indicated.
- Spring 2026 - Information Literacy
- Fall 2026 - Oral Communication
- Spring 2027 - Intercultural Knowledge & Skills
Essential Studies Assessment Training
Essential Studies Assessment Process
The resources below provide a brief overview of the Essential Studies (ES) process, including the ES learning goals, scoring rubric, and resources instructors can use to help with ES reporting.
The resources below explain how to enter Essential Studies (ES) data, including how to report data from multiple course sections, how to use the rubric, and how to enter "not applicable" data.
Rubrics
- ES Written Communication
- ES Oral Communication
- ES Quantitative Reasoning
- ES Information Literacy
- ES Intercultural Knowledge & Skills
- ES Critical Inquiry & Analysis
Assessment Results
The goal assessed in Spring 2026 was Information Literacy. The assessment rubric includes five categories. Instructors must assess students against all five categories.
There were 811 students assessed across 19 courses and six colleges. There were 24 submissions. Missing data was not included.
Determine Exten t of Information Needed
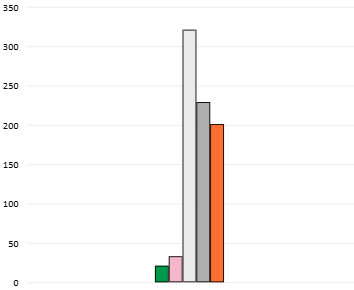
- Did not meet benchmark: 21 students
- Benchmark: 33 students
- Beginning milestone: 321 students
- Intermediate milestone: 229 students
- Capstone: 201students
Access Needed Information
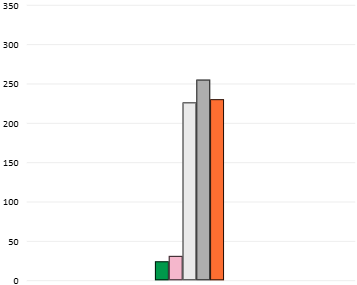
- Did not meet benchmark: 24 students
- Benchmark: 31 students
- Beginning milestone: 226 students
- Intermediate milestone: 255 students
- Capstone: 230 students
Evaluate Information & Sources Critically
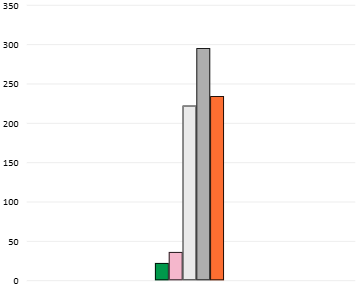
- Did not meet benchmark: 22 students
- Benchmark: 36 students
- Beginning milestone: 222 students
- Intermediate milestone: 295 students
- Capstone: 234 students
Uses Information Effectively
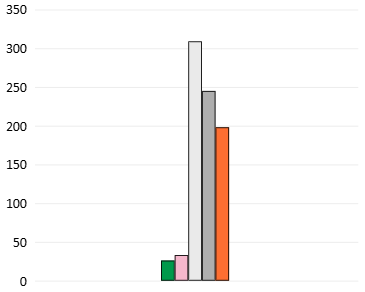
- Did not meet benchmark: 26 students
- Benchmark: 33 students
- Beginning milestone: 309 students
- Intermediate milestone: 245 students
- Capstone: 198 students
Access & Use Information Ethically & Legally
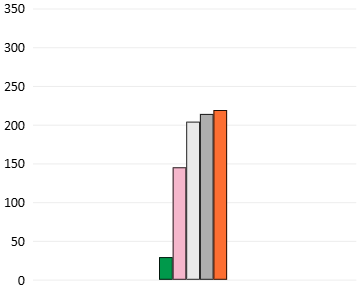
- Did not meet benchmark: 29 students
- Benchmark: 145 students
- Beginning milestone: 204 students
- Intermediate milestone: 214 students
- Capstone: 219 students
The goal assessed in Fall 2025 was Quantitative Reasoning. The assessment rubric includes six categories. Instructors must assess students against five of the six categories.
There were 6,148 students assessed across 36 courses and six colleges. There were 75 submissions. Missing data was not included.
Interpretation
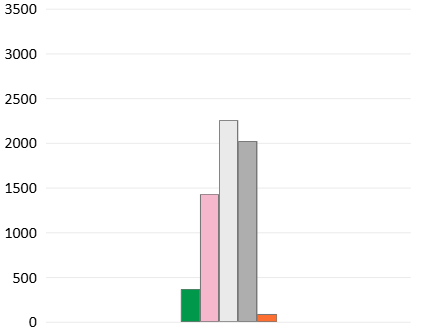
- Did not meet benchmark: 362 students
- Benchmark: 1425 students
- Beginning milestone: 2254 students
- Intermediate milestone: 2020 students
- Capstone: 87 students
Representation
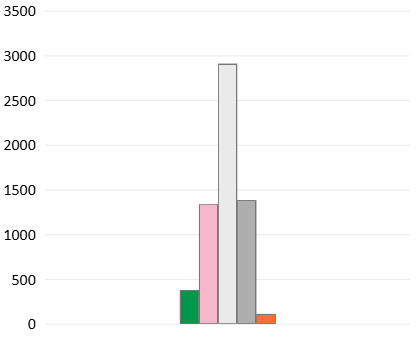
- Did not meet benchmark: 376 students
- Benchmark: 1335 students
- Beginning milestone: 2909 students
- Intermediate milestone: 1382 students
- Capstone: 110 students
Calculation
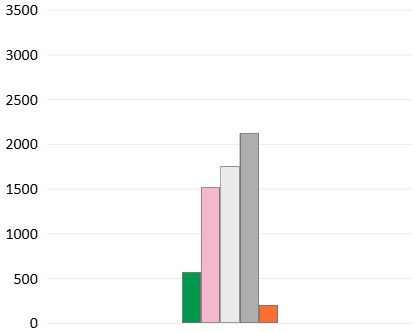
- Did not meet benchmark: 568 students
- Benchmark: 1514 students
- Beginning milestone: 1750 students
- Intermediate milestone: 2118 students
- Capstone: 198 students
Application & Analysis
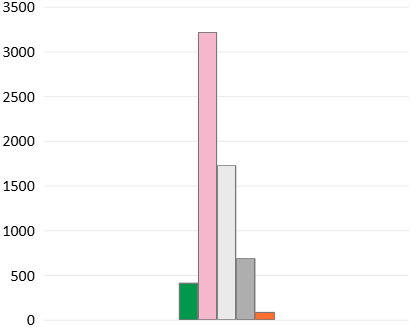
- Did not meet benchmark: 415 students
- Benchmark: 3216 students
- Beginning milestone: 1727 students
- Intermediate milestone: 686 students
- Capstone: 88 students
Assumptions
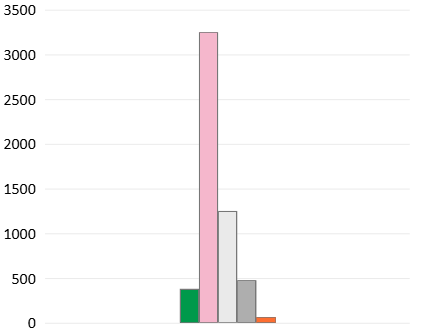
- Did not meet benchmark: 380 students
- Benchmark: 3248 students
- Beginning milestone: 1250 students
- Intermediate milestone: 475 students
- Capstone: 61 students
Communication
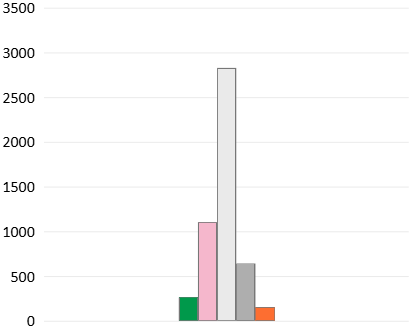
- Did not meet benchmark: 260 students
- Benchmark: 1102 students
- Beginning milestone: 2827 students
- Intermediate milestone: 640 students
- Capstone: 152 students
The learning goal assessed in Spring 2025 was Critical Inquiry & Analysis. The assessment rubric includes six categories. Instructors must assess students against five of the six categories.
There were 3,028 students assessed across 56 courses and five colleges. There were 74 submissions. Missing data was not included.
Topic Selection
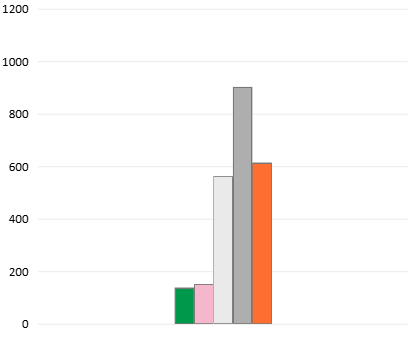
- Did not meet benchmark: 138 students
- Benchmark: 151 students
- Beginning milestone: 562 students
- Intermediate milestone: 902 students
- Capstone: 614 students
Existing Knowledge, Research, and/or Views
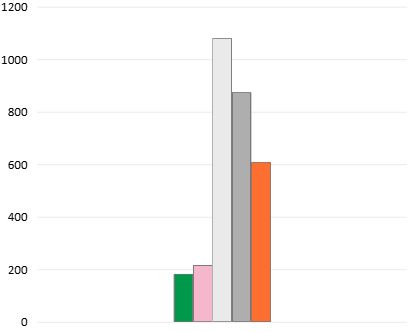
- Did not meet benchmark: 180 students
- Benchmark: 216 students
- Beginning milestone: 1080 students
- Intermediate milestone: 874 students
- Capstone: 607 students
Design Process
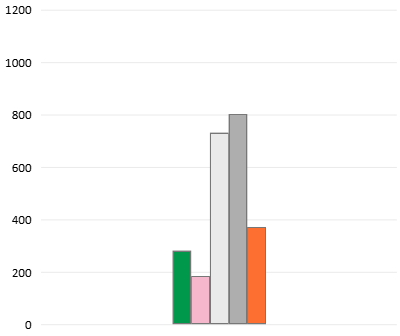
- Did not meet benchmark: 281 students
- Benchmark: 184 students
- Beginning milestone: 731 students
- Intermediate milestone: 802 students
- Capstone: 371 students
Analysis
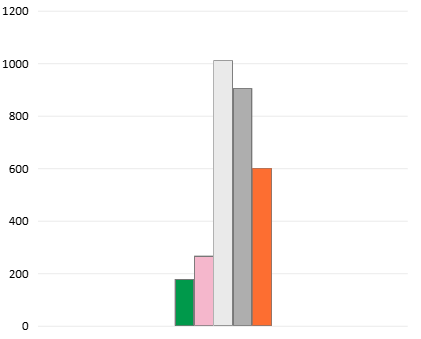
- Did not meet benchmark: 178 students
- Benchmark: 267 students
- Beginning milestone: 1011 students
- Intermediate milestone: 905 students
- Capstone: 599 students
Conclusions
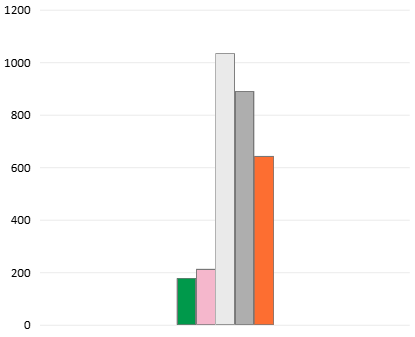
- Did not meet benchmark: 177 students
- Benchmark: 213 students
- Beginning milestone: 1034 students
- Intermediate milestone: 890 students
- Capstone: 643 students
Limitations & Implications
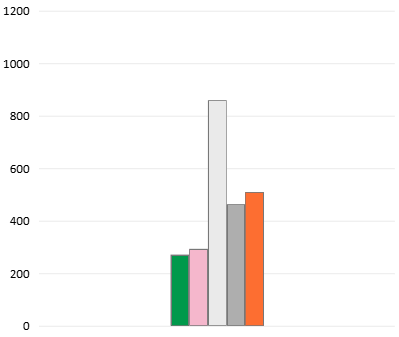
- Did not meet benchmark: 271 students
- Benchmark: 293 students
- Beginning milestone: 859 students
- Intermediate milestone: 462 students
- Capstone: 509 students
Data collection was paused in Fall 2024.
The learning goal assessed in Spring 2024 was Written Communication. The assessment rubric includes five categories. Instructors must assess students against all five categories.
There were 2,320 students assessed across 39 courses and seven colleges. There were 49 submissions. Missing data was not included.
Context & Purpose
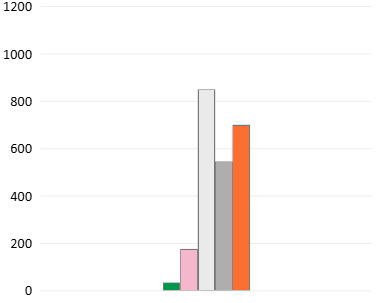
- Did not meet benchmark: 33 students
- Benchmark: 175 students
- Beginning milestone: 848 students
- Intermediate milestone: 544 students
- Capstone: 699 students
Content Development
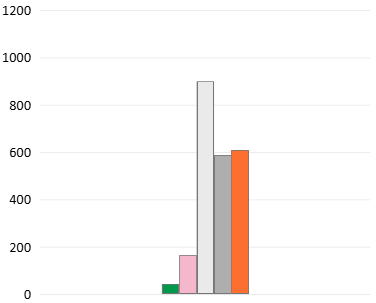
- Did not meet benchmark: 41 students
- Benchmark: 164 students
- Beginning milestone: 899 students
- Intermediate milestone: 587 students
- Capstone: 608 students
Genre & Disciplinary Conventions
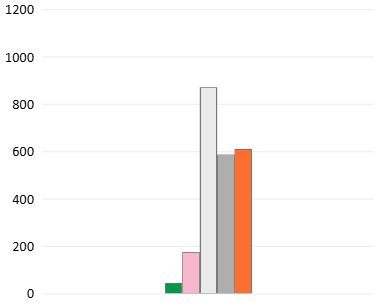
- Did not meet benchmark: 42 students
- Benchmark: 174 students
- Beginning milestone: 870 students
- Intermediate milestone: 586 students
- Capstone: 610 students
Sources & Evidence
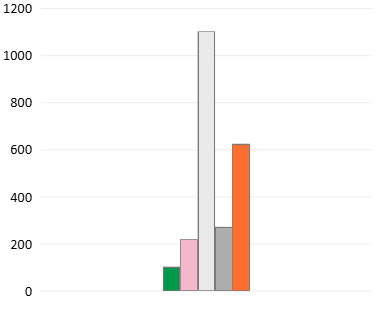
- Did not meet benchmark: 102 students
- Benchmark: 218 students
- Beginning milestone: 1101 students
- Intermediate milestone: 271 students
- Capstone: 624 students
Control of Syntax & Mechanics
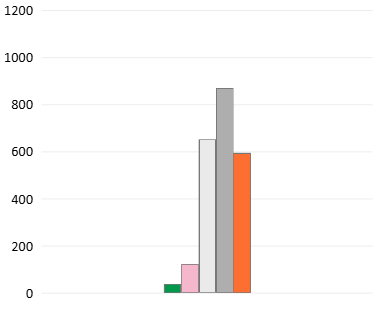
- Did not meet benchmark: 36 students
- Benchmark: 121 students
- Beginning milestone: 651 students
- Intermediate milestone: 869 students
- Capstone: 594 students
The learning goal assessed in Fall 2023 was Intercultural Knowledge & Skills. The assessment rubric includes six categories. Instructors must assess students against at least five of the six categories.
There were 2,838 students assessed across 30 courses and six colleges. There were 77 submissions. Missing data was not included.
Cultural Self-Awareness
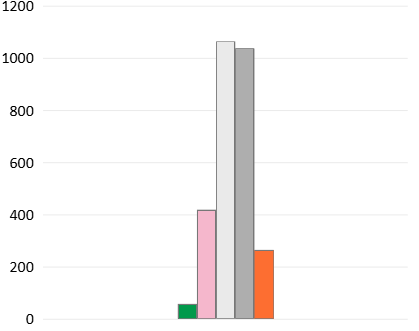
- Did not meet benchmark: 57 students
- Benchmark: 418 students
- Beginning milestone: 1063 students
- Intermediate milestone: 1036 students
- Capstone: 264 students
Knowledge of Cultural Worldview Frameworks
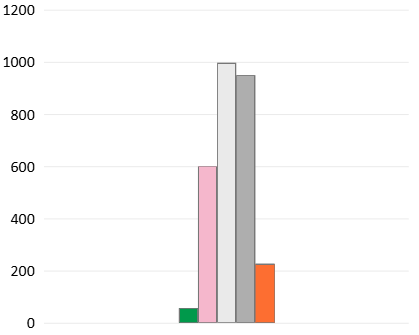
- Did not meet benchmark: 56 students
- Benchmark: 599 students
- Beginning milestone: 997 students
- Intermediate milestone: 949 students
- Capstone: 227 students
Empathy
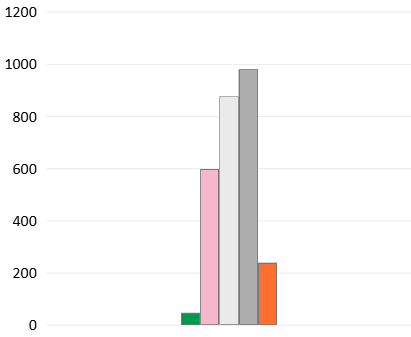
- Did not meet benchmark: 46 students
- Benchmark: 597 students
- Beginning milestone: 875 students
- Intermediate milestone: 979 students
- Capstone: 238 students
Verbal & Nonverbal Communication
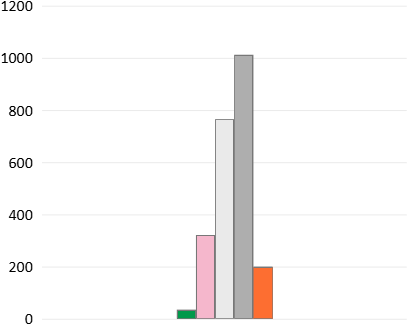
- Did not meet benchmark: 35 students
- Benchmark: 321 students
- Beginning milestone: 765 students
- Intermediate milestone: 1012 students
- Capstone: 200 students
Curiosity
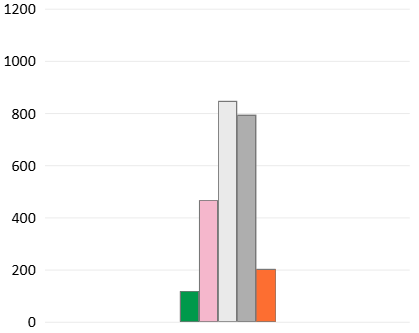
- Did not meet benchmark: 117 students
- Benchmark: 466 students
- Beginning milestone: 847 students
- Intermediate milestone: 794 students
- Capstone: 203 students
Openness
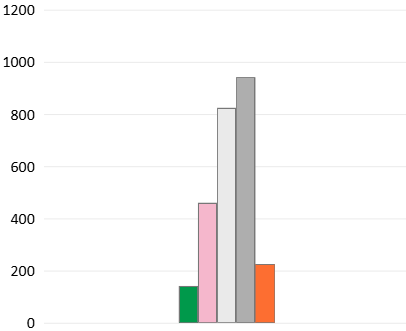
- Did not meet benchmark: 141 students
- Benchmark: 460 students
- Beginning milestone: 842 students
- Intermediate milestone: 941 students
- Capstone: 225 students
The learning goal assessed in Spring 2023 was Oral Communication. The assessment rubric includes five categories. Instructors must assess students against all five categories.
There were 332 students assessed across 8 courses and three colleges. There were 11 submissions. Missing data was not included.
Organization
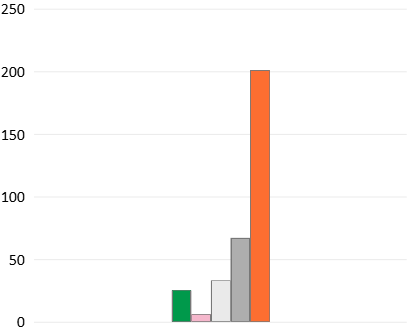
- Did not meet benchmark: 25 students
- Benchmark: 6 students
- Beginning milestone: 33 students
- Intermediate milestone: 67 students
- Capstone: 201 students
Language
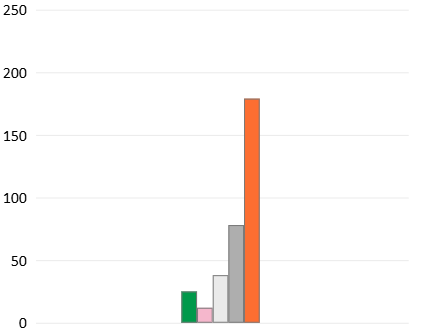
- Did not meet benchmark: 25 students
- Benchmark: 12 students
- Beginning milestone: 38 students
- Intermediate milestone: 78 students
- Capstone: 179 students
Delivery
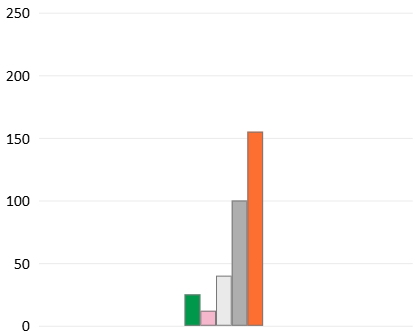
- Did not meet benchmark: 25 students
- Benchmark: 12 students
- Beginning milestone: 40 students
- Intermediate milestone: 100 students
- Capstone: 155 students
Supporting Material
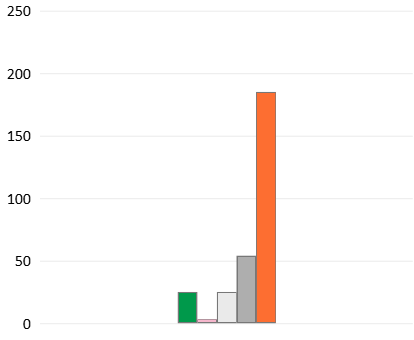
- Did not meet benchmark: 25 students
- Benchmark: 3 students
- Beginning milestone: 25 students
- Intermediate milestone: 54 students
- Capstone: 185 students
Central Message
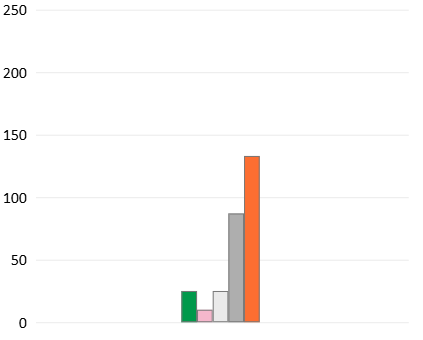
- Did not meet benchmark: 25 students
- Benchmark: 10 students
- Beginning milestone: 25 students
- Intermediate milestone: 87 students
- Capstone: 133 students
The learning goal assessed in Fall 2022 was Information Literacy. The assessment rubric includes five categories. Instructors must assess students against all five categories.
There were 792 students assessed across 14 courses and five colleges. There were 16 submissions. Missing data was not included.
Determine Extent of Information Needed
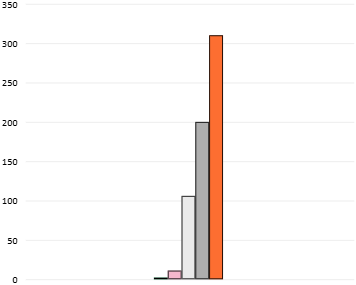
- Did not meet benchmark: 2 students
- Benchmark: 11 students
- Beginning milestone: 106 students
- Intermediate milestone: 200 students
- Capstone: 310 students
Access Needed Information
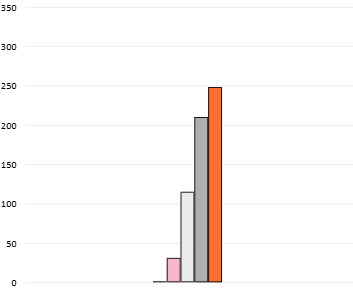
- Did not meet benchmark: 1 student
- Benchmark: 31 students
- Beginning milestone: 115 students
- Intermediate milestone: 210 students
- Capstone: 248 students
Evaluate Information & Sources Critically
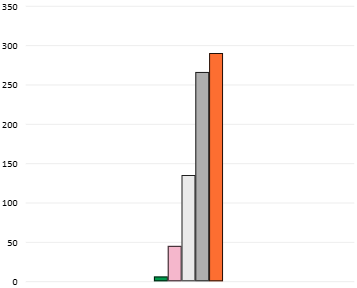
- Did not meet benchmark: 6 students
- Benchmark: 45 students
- Beginning milestone: 135 students
- Intermediate milestone: 266 students
- Capstone: 290 students
Uses Information Effectively
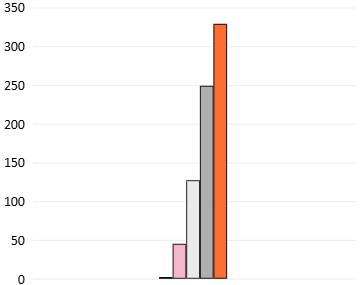
- Did not meet benchmark: 2 students
- Benchmark: 45 students
- Beginning milestone: 127students
- Intermediate milestone: 249 students
- Capstone: 329 students
Access & Use Information Ethically & Legally
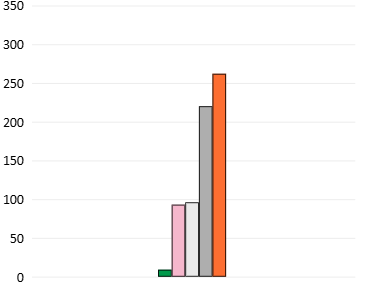
- Did not meet benchmark: 9 students
- Benchmark: 93 students
- Beginning milestone: 96 students
- Intermediate milestone: 220 students
- Capstone: 262 students
We do not have data summaries from 2020 or 2021. We did not receive a summary from our VALUE Institute data submissions in 2020 and chose at that time to no longer submit work to them for our assessment purposes. We did not collect any data in 2021 as we were developing a new process that will result in data collection during Fall 2022.
In February 2018, senior students (n=171) in ES Capstone courses volunteered to take a specially designed “performance task” that presented them with a scenario asking them to produce work focused on the ES Information Literacy (IL) learning goal. The task was designed by UND faculty members to determine the level of accomplishment of UND students relative to this aspect of the ES Program. The task was aligned with the Association of American Colleges & Universities’ VALUE rubric for IL. In May 2018, faculty and staff (n=28) participated in a “scoring session” in which they assessed the students’ work from February 2018. Below are summarized the results from the scoring session.
Majority selected Developing.
| Alignment: | Left |
|---|---|
| Image: | 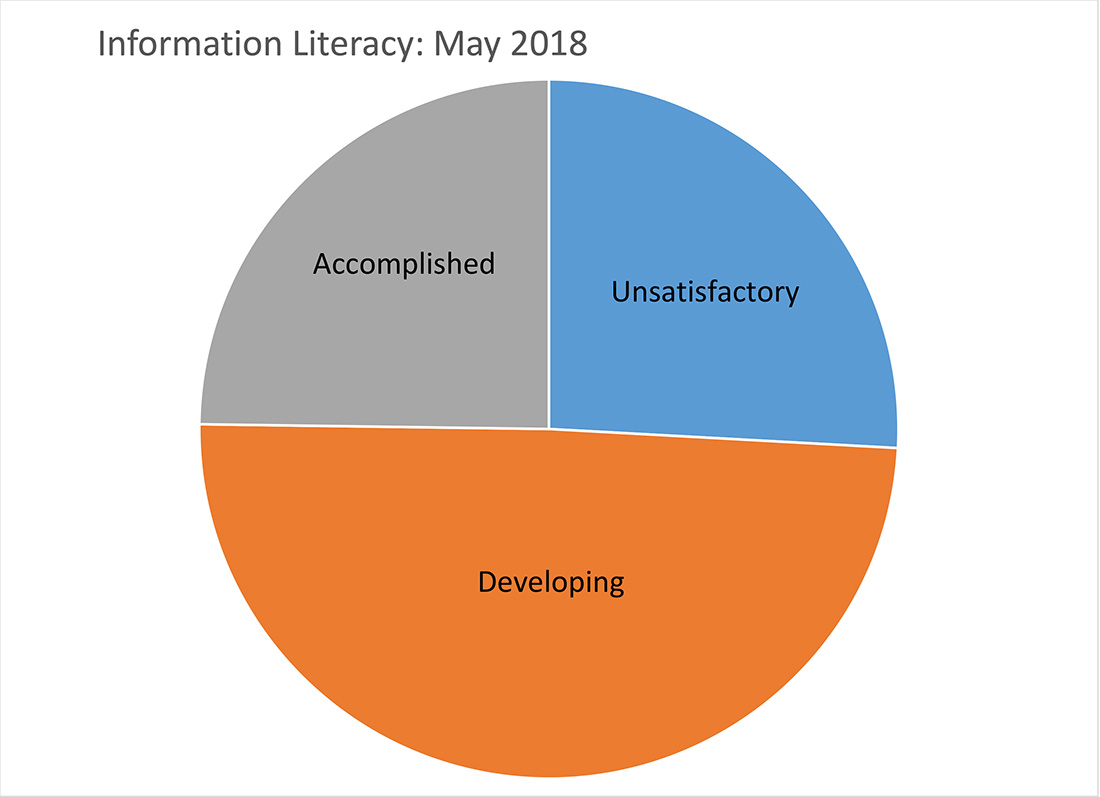 |
| Caption: |
Data Summaries
Information Literacy: Scoring Results and Brief Analysis
In February 2017, senior students (n = 240) in ES Capstone courses volunteered to take a specially designed “performance task” that presented them with a scenario asking for them to produce work focused on the ES Critical Inquiry & Analysis learning goal. The task was designed by UND faculty members to determine the level of accomplishment of UND students relative to the ES CI&A learning goal. The task was aligned with both UND’s ES CI&A criteria and UND’s CI&A Assessment Rubric. In December 2017, faculty and academic staff (n = 28) participated in a “scoring session” in which they assessed the students’ work from February 2017. Below are summarized the results from the scoring session for the 195 student work products scored the requisite number of times (2 under most circumstances, 3 times when the first two scorings disagreed substantially).
Majority selected Score Range of 2 or Less.
| Alignment: | Left |
|---|---|
| Image: | 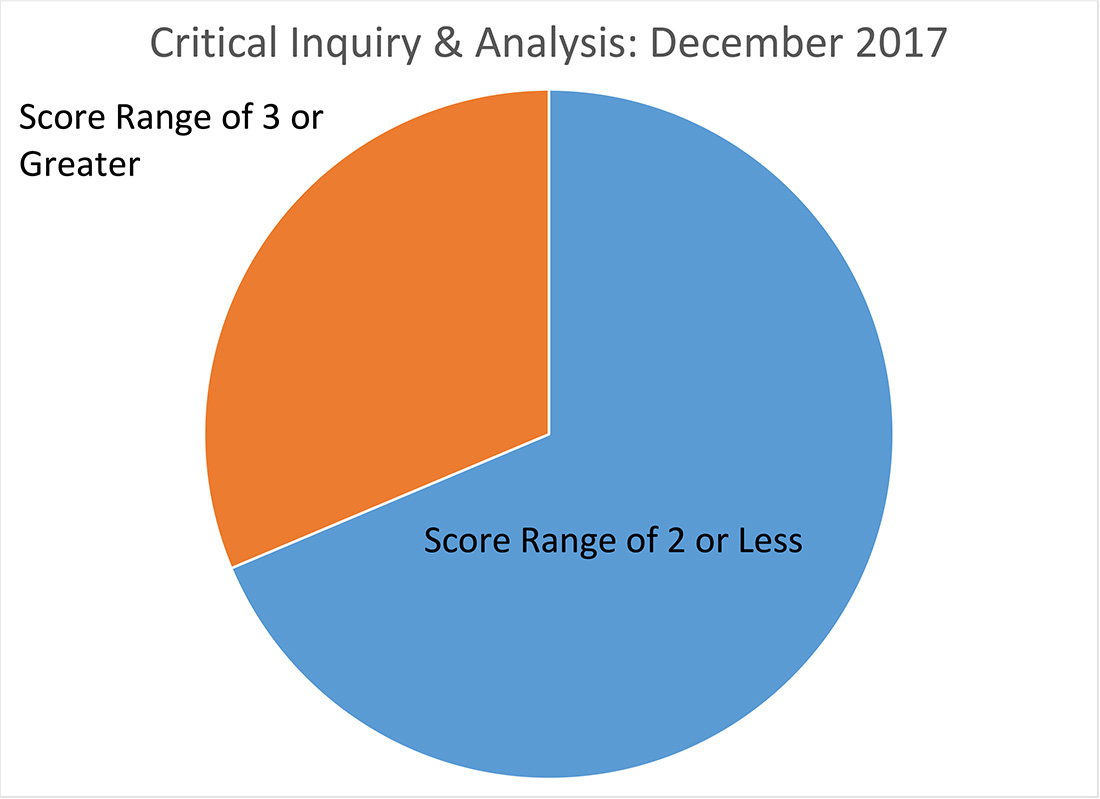 |
| Caption: |
Data Summaries
Critical Thinking and Written Communication: Scoring Session Results/Report
A total of 86 faculty and staff scorers interacted with approximately 350 students at the Spring 2017 UNDergraduate Showcase poster session.
Data quality considerations and assessment methodology:
- Pre-scoring “norming” process was used to achieve scorer consistency.
- Scorers were randomly assigned to interact with students to avoid systematic scoring biases.
- Scoring sample came from a subset of the total population of ES capstone students, and thus was not a true random sample.
- Only students scored by at least two independent scorers were considered for the final analysis.
- In the large majority of cases the spread between scorers’ results for the same student differed by 2 points or less (out of a maximum of 6).
Scorer Variability
Score range of two or less is significantly larger than score range of three or greater.
| Alignment: | Left |
|---|---|
| Image: | 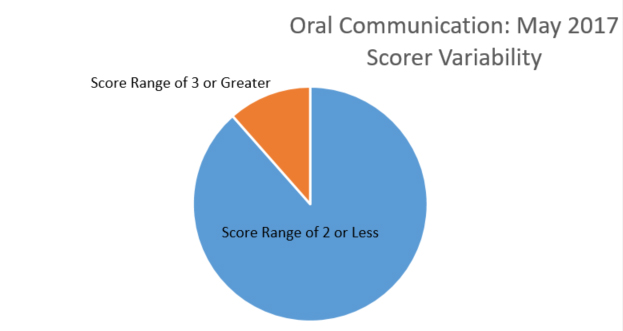 |
| Caption: |
Score Distribution
Approximately 68 selected Accomplished (4.5-6).
| Alignment: | Left |
|---|---|
| Image: | 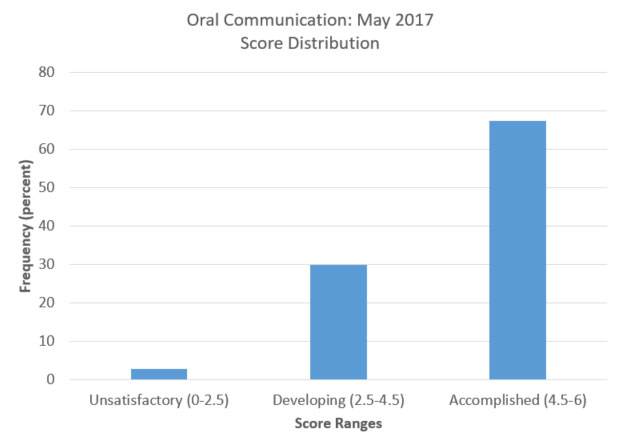 |
| Caption: |
For results with the highest-possible reliability and validity, we focus on the 836 scoring instances with a maximum scorer spread of 0 or 1:
- Oral Communication, May 2017: Scoring Results (Undergraduate Showcase and Brief Analysis)
Interpreting Results
These results suggest UND students’ oral communication abilities are rarely “unsatisfactory,” with more than 2/3 scoring as “accomplished.”
A total of 20 faculty and staff scored approximately 85 students’ written work from a performance task developed by UND faculty and which was focused on the ES Written Communication learning goal. Students completed their work during the February 2016 Assessment Week.
Data Quality Considerations and Assessment Methodology:
- Pre-scoring “norming” process was used to achieve scorer consistency.
- Scorers were randomly assigned to assess students’ work to avoid systematic scoring biases.
- Scoring sample came from a subset of the total population of ES capstone students, and thus was not a true random sample.
- Only students scored by at least two independent scorers were considered for the final analysis.
- In the large majority of cases the spread between scorers’ results for the same student differed by 2 points or less (out of a maximum of 6).
Scorer Variability
A significant amount selected Score Range of 2 or Less.
| Alignment: | Left |
|---|---|
| Image: | 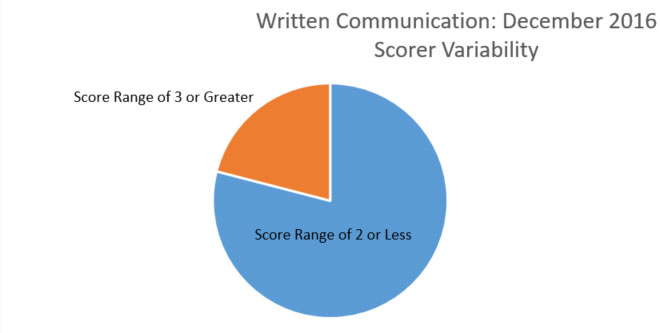 |
| Caption: |
Results Summary
Majority selcted Developing (2.5-4.5)
| Alignment: | Left |
|---|---|
| Image: | 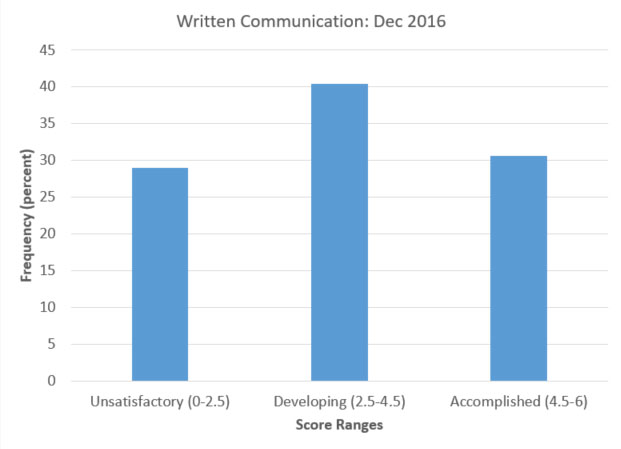 |
| Caption: |
- For results with the highest-possible validity, we focus on the 183 scoring instances of ES capstone students with a scorer spread of 0 or 1:
- Written Communication Scoring Session, December 2016: Scoring Results and Brief Analysis
Interpreting Results
There is clear room for improvement, as only approximately 30% of students produced work in the “accomplished” category.
A total of 22 faculty and staff scored approximately 100 students’ written work from a performance task developed by UND faculty which was focused on the ES Diversity learning goal (this was the name and framework for the goal before being revised to become Intercultural Knowledge & Skills). Students completed their work during the February 2016 Assessment Week.
Data Quality Considerations and Assessment Methodology:
- Pre-scoring “norming” process was used to achieve scorer consistency.
- Scorers were randomly assigned to assess students’ work to avoid systematic scoring biases.
- Scoring sample came from a subset of the total population of ES capstone students, and thus was not a true random sample.
- Only students scored by at least two independent scorers were considered for the final analysis.
- In the large majority of cases the spread between scorer’s results for the same student differ by 2 points or less (out of a maximum spread of 6).
Scorer Variability
Majority selected Score Range of 2 or less.
| Alignment: | Left |
|---|---|
| Image: | 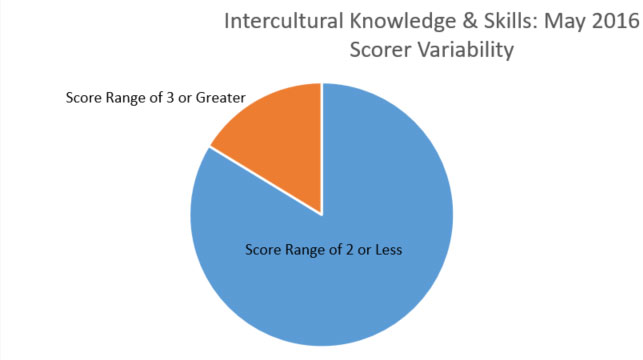 |
| Caption: |
Results
Majority selected Unsatisfactory (0-2.5).
| Alignment: | Left |
|---|---|
| Image: | 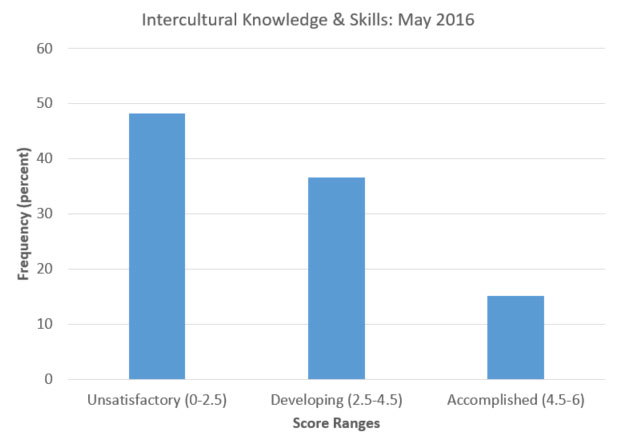 |
| Caption: |
- For results with the highest possible validity, we focus on the 270 scoring instances of ES capstone students with a scorer spread of 0 or 1:
- Diversity Scoring Session, May 2016: Scoring Results and Brief Analysis
Interpreting Results
- These results were discouraging, as only approximately 15% of students produced work in the “accomplished” category, and almost a majority showed scores in the “unsatisfactory” category.
- Because of the key piece of evidence provided by these results, the ES requirements in this particular area have been revised, and involve strengthened course criteria and expectations.
A total of 15 faculty and staff scored approximately 120 students’ written work from a performance task developed by UND faculty which was focused on the ES Quantitative Reasoning learning goal. Students completed their work during the February 2015 Assessment Week.
Data Quality Considerations and Assessment Methodology:
- Pre-scoring “norming” process was used to achieve scorer consistency.
- Scorers were randomly assigned to assess students’ work to avoid systematic scoring biases.
- Scoring sample came from a subset of the total population of ES capstone students, and thus was not a true random sample.
- Only students scored by at least two independent scorers were considered for the final analysis.
- In the large majority of cases the spread between scorer’s results for the same student differ by 2 points or less (out of a maximum spread of 6).
Scorer Variability
Majority selected Score Range of 2 or Less.
| Alignment: | Left |
|---|---|
| Image: | 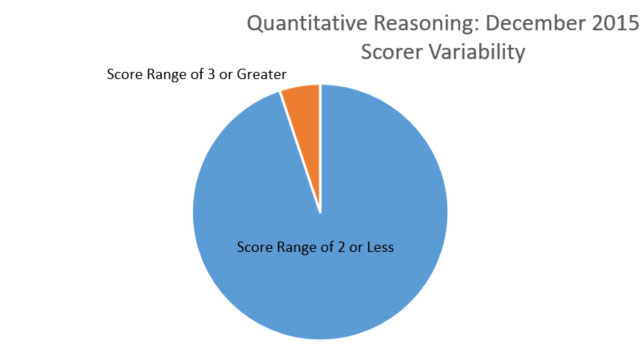 |
| Caption: |
Results
Majority selected Accomplished (4.5-6).
| Alignment: | Left |
|---|---|
| Image: | 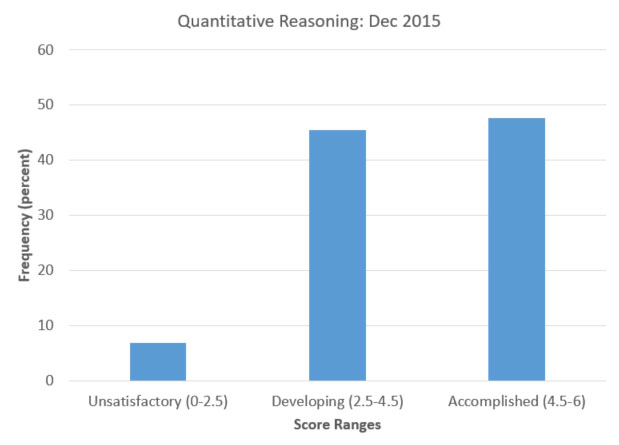 |
| Caption: |
- For results with the highest possible validity, we focus on the 363 scoring instances of ES capstone students with a scorer spread of 0 or 1:
- Quantitative Reasoning Scoring Session, December 2015: Scoring Results and Brief Analysis
Interpreting Results
- Roughly 45% of students scored in each of the “accomplished” and “developing” categories, indicating clear room for improvement.
- A previous instance of quantitative reasoning assessment showed a greater percentage of students in the “Unsatisfactory” and “Accomplished” categories. Thus there was both positive and negative progress made between the two assessment instances.
Contact
For more information about the Essential Studies assessment process, contact:
Allyssa Baumbach
Senior Specialist of Assessment & Analytics