Microsoft Excel
Make your Excel work for everyone
Accessibility Action Items
General Accessibility | Structural Accessibility | Advanced Accessibility | Preparing to Save | Resources
Ensuring accessibility in Excel is essential for creating inclusive and usable documents. Refer to the Accessibility Checklist for Microsoft Excel to verify that your file meets the needs of all readers. In addition, Excel users must complete the following action items to fully achieve accessibility standards.
General Accessibility
Consult some general accessibility guidelines.
To ensure readability for all users, follow these best practices when formatting text:
-
Font Style and Size: Use a clear, easy-to-read font such as Arial, Calibri, Helvetica, or Futura. Avoid decorative fonts like script, serif fonts, or symbols (e.g., WingDings), as they can be difficult for users to read. Additionally, set the font size to at least 12 pt. to ensure legibility.
-
Text Visibility: Make sure all text is fully visible within each cell. Do not rely on viewers to adjust or format text themselves.
- If text overflows beyond the cell, either increase the column width or enable text wrapping.
- Adjust spacing and layout as needed to ensure no content is hidden or cut off.
Ensure that text, diagrams, charts, and other meaningful content meet the following contrast ratios.
- Images should have a contrast ratio of at least 4.5:1.
- Normal sized text should have a contrast ratio of at least 4.5:1
- Large sized text should have a contrast ratio of at least 3:1. Large sized text consists of an 18 pt font or higher or a 14 pt. font bolded.
- Text in logos do not have a contrast requirement.
Use online contrast checkers like WebAIM to ensure compliance with accessibility standards.
Image Description, otherwise known as Alternative text, is a brief written description that conveys the meaning of an image for individuals who cannot see it. This is especially important for screen reader users, as it ensures that visual content is accessible to everyone.
In Excel, screen readers will identify images simply as “Image” unless alt-text is provided. Without a description, users miss out on the information the image, chart, or graph is meant to convey.
[Note: Unlike in Word or PowerPoint, screen readers do not automatically read alternative text from the designated Alt Text field.]
Placement of Image Descriptions
Since the traditional Alt Text field is not reliably read by screen readers in Excel, include the image description directly in the sheet body—ideally in Cell A1. This ensures it is easily found and read as soon as the document is opened.

Graphs and Charts must be fully labeled with a title, legend, labels, and data labels. This will benefit all users—not just those using assistive tech.

Creating tables is one of Microsoft Excel's main functions. For users relying on assistive technology, table accessibility relies on simplicity and good structure. When creating tables in Excel, follow these best practices to ensure your table is easy for everyone to navigate and understand.
-
Keep it Simple: Avoid complex table layouts. Simple tables are easier for screen readers to interpret.
-
One Table per Worksheet: Limit each worksheet to a single table when possible.
-
Start in Column A: Tables should begin in Column A and read vertically down the sheet.
-
Separate Multiple Tables: If multiple tables are necessary, separate them with at least one blank row.
-
Avoid Merged, Blank, or Split Cells: These can create issues for screen reader users, who may not be able to navigate the table in a logical reading order.
Table Titles
Every table should have a descriptive title that includes a table number. The title must be placed in two locations in Excel:
- In the sheet body, directly above the table — for sighted users.
- In the Ribbon under the Table Design tab; this embeds the title in the table’s code for screen reader users.

Table Header Row
A table header row is the top row of a table that serves as a label for each column’s content. You are probably used to bolding or italicizing information in table header rows, but this alone does not enable screen readers to recognize and read aloud header information. Table headers must be marked at the code level so the change is structural. You can't tell from looking at a table if it's been manually bolded or not - but screen readers will read structural headers aloud, aiding in ease of navigation and accuracy.
Set a Structural Table Header
- Highlight the row you want as the header.
- Go to the Design tab in the Ribbon.
- Check the Header Row box.

Descriptive links provide users with proper context for links. In other words, they tell the user exactly where they will go if they click on a descriptive link. This ensures all users can easily understand and navigate your document. Descriptive link text is especially important for people using assistive technology. Screen reader users navigate documents by either tabbing through links or viewing a links list, which takes the link out of the context of the surrounding text. Additionally, people using voice recognition also rely on precise link text to navigate efficiently.
- For more information on descriptive links, download our Guide to Writing Descriptive Links.
Structural Accessibility
Excel is a powerful spreadsheet software designed to manage and analyze data. Excel's organizational structure revolves around three key elements: Workbooks, Worksheets, and Cells. The workbook is the primary file containing all the data. Within each workbook, users can create multiple worksheets. This allows users to organize and separate different types of data. Individual worksheets are comprised of many cells where users enter data, text, numbers, and formulas.
This complex structure can make it difficult for users to navigate content. Simplify navigation by adhering to the following structural accessibility guidelines.
Excel can be more challenging to navigate than other Microsoft Office applications due to its grid-based layout and complexity. Unlike Word—where screen reader users can read through a document continuously—Excel requires users to take a more active role in navigating.
Because of this, it’s crucial to structure your content in a logical, predictable way. Data in Excel should read:
- Left to Right
- Row by Row.
This predictable reading order helps screen reader users understand and follow your content with minimal effort.
Assigning unique, descriptive names to all Excel worksheets is essential for effective organization and navigation. Descriptive sheet names clarify the content and purpose of each worksheet, making it easier to locate specific data. This practice is especially important for screen reader users, as it enhances their ability to navigate files.
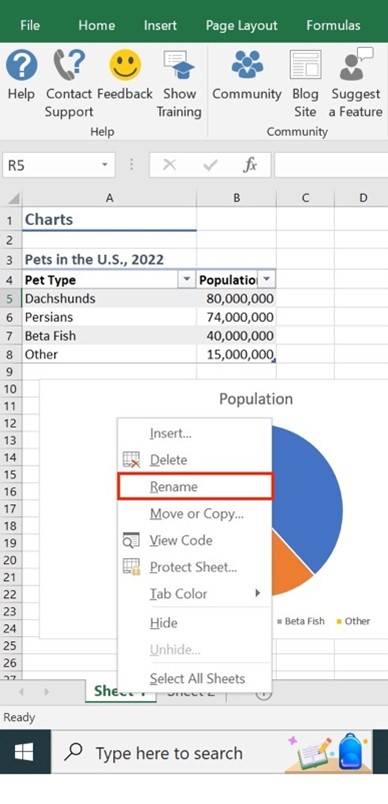
Renaming Sheets
By default, Excel names worksheets as Sheet 1, Sheet 2, etc.
To rename a worksheet
- Navigate to the bottom of the Excel file where the sheet tabs are located.
- Right-click on the default sheet name.
- Select Rename from the menu
- Type the new name directly into the sheet tab.
- Press Enter to save the new name.
Data for each worksheet should generally begin in cell A1. Since A1 is the default starting point for new spreadsheets, screen readers automatically begin reading data from this cell. If no text appears in cell A1, screen readers may may interpret the worksheet as blank. Therefore, it is best to put the most important information in this cell.
Relevant Content:
- Titles for images, charts, graphs, or tables
- Worksheet or workbook summaries to orient the reader
- Image descriptions (alt-text) for visual content like charts or graphs
Avoid blank cells, rows, and columns in a sheet. Blank spaces in an Excel worksheet can be confusing and frustrating for screen reader users. When encountering empty cells, users may think they've reached the end of the content or be unsure how far they need to navigate to find the next relevant item. This can lead to frustration and missed information.
Exceptions
There are a few instances in which a limited use of blank spaces is acceptable:
- You may leave one blank row between multiple tables on the same sheet.
- You may leave one blank column between tables or images for visual separation.
[Note: Do Not leave multiple blank rows or columns in a sheet.]
Intentionally Blank Data Cells
If a data cell is left blank intentionally (e.g., due to unavailable data), it should still include a text alternative to indicate why it’s empty. This ensures that screen reader users receive the same information as sighted users.
Acceptable alternatives may include:
- Using plain text like "No Data" or "Not Available".
- Using abbreviations such as "ND" (for No Data) or "NA" (for Not Available).
When using abbreviations, you must define the abbreviation somewhere on the sheet, such as in Cell A1 or in a worksheet summary.
[Note: Avoid using symbols (like dashes or slashes) as substitutes for text. Not all screen readers interpret symbols correctly. Always use verifiable, readable text.]

An Index page in Excel functions like a Table of Contents in Word—it helps users quickly and easily navigate through a workbook. This is especially important in workbooks with three or more sheets, where navigation can become difficult.
Content of an Index Page
Your Index page should include the following elements:
- Cell A1: A brief summary of the workbook’s content
- Cell A2: The title of the sheet (e.g., Index)
- Cell A3 and below: A list of links to the individual sheets within the workbook

Insert an Internal Reference Link
- Right-click on the cell where you want to place the link.
- Select Link (or Hyperlink).
- In the dialog box, choose Place in This Document.
- Select the sheet you want to link to.
- To link to Cell A1, leave the cell reference as is.
- To link to a different cell, manually change the cell reference.
- Click OK.
Advanced Accessibility
The items in this section will not apply to the general user. Utilize these best practices only if applicable.
When using color to convey information, it is essential to include a text alternative so that all users—including those who are color blind or visually impaired—can understand the content. Information should never rely solely on color for meaning, as users who cannot perceive color differences may miss important details. Screen readers cannot interpret color, so any meaning conveyed through color must also be presented in text.
Not only must a text equivalent be available, but it must also convey all of the same relevant information conveyed by color. Depending on the layout of the sheet, this text alternative could be incorporated into the table, added into an image description, or included in a graph or chart.
Bad Example
This table relies on color to convey meaning.

Good Example
This table uses a text equivalent.

Not all screen readers interpret symbols the same way. Some may skip them entirely or mispronounce them, depending on the user's device, screen reader software, or settings. Because we can't predict which tools users rely on, it's best to use plain text alternatives when possible.
To ensure your content is clear and accessible, replace or accompany symbols with descriptive text.
- Use "less than or equal to" instead of ≤
- Use "Delta Phi Mu" instead of ΔΦΜ
Screen Reader Friendly Symbols
While symbols can cause difficulty for many screen reader users, there are some symbols that are commonly recognized and read correctly by most screen readers, including JAWS, NVDA, and VoiceOver. These include:
- @ (the at symbol)
- & (ampersand)
- / (slash)
- © (copyright)
- ® (registered)
- ™ (trademark)
- ¶ (paragraph)
- • (bullet)
- $ (dollar)
- € (Euro)
- £ (British pound)
- ¥ (Yen)
- % (percent)
- ½ (one half)
- ¼ (one fourth)
- ¾ (three fourths)
- ° (degrees)
Embedded files are inserted as floating objects, which means users cannot navigate to them using arrow keys. This creates a challenge for screen reader users, who rely on keyboard navigation through cells.
To address this, place all embedded files on a separate worksheet dedicated solely to those files. This sheet must include the following:
- A worksheet summary in Cell A1 alerting screen reader users that an embedded file is present
- Instructions for accessing an embedded file, including keyboard shortcuts
- The type of file embedded

When content is added into Excel, it sometimes becomes a floating object. These objects exist on a separate layer outside of the cell grid, which means screen reader users cannot navigate to them easily using keyboard controls. Floating objects include images, charts, graphs, embedded objects, text boxes, WordArt, SmartArt, and equations.
To make floating objects accessible, you should provide an image description or relevant text within the cell layer, ideally in Cell A1. This ensures screen readers can access the content even if the visual object itself cannot be reached.
In the case of some floating objects, adding an image description may seem redundant for sighted users. Since the object floats, you can move the floating object so that it visually overlaps with the description in the cell. This won't interfere with screen reader users and allows everyone to get the information they need.
While Excel is primarily a data tool, there may be occasions when you need to incorporate audio or video elements. Rather than embedding audio or video directly into your Excel file, it is best to link out to media stored externally (e.g., Cloud storage, streaming platform, web, etc.). When linking to these files, ensure that you are using descriptive links.
All audio and video content must meet the WCAG 2.1 AA accessibility standards, which include:
- Captions for all video content
- Transcripts for both audio and video content
Transcripts should be inserted as an embedded file or linked out to. The transcript embed or link must be conveniently located near the initial video/audio link.
Accessibility Consideration When Preparing to Save
When preparing to save a document, there are a few clean up features that help with accessibility.
Use the Spell Check feature in Excel to ensure that data in your sheets are correct. Misspelled words can confuse all users, but they pose a particular challenge for screen reader users, as incorrect spelling may lead to mispronunciations or misinterpretations of the content.
Run the Accessibility Checker to test for accessibility issues. This checker scans your document for potential issues that might prevent people with disabilities from accessing the content properly. It will highlight the issues, provide suggestions on how to fix them, and then prompt you to fix these issues. For more information, see Microsoft's Support documentation on Improving Accessibility with the Accessibility Checker.
[Note: Ignore any issues flagged from missing Alternative Text. All alternative text/image descriptions should be placed in the cell layer rather than the customary Alt Text box.]
Ensure that you delete all blank worksheets. Excel does not automatically delete unused sheet tabs, which can create unnecessary clutter and confusion—especially for screen reader users. Manually deleting blank or unused sheets to keep a focused workbook.
Metadata is the descriptive information embedded within a file that helps identify and organize the document. This data is not visible to the eye; rather, it is contained within the code.
Required metadata includes
- title
- language
- author
- subject
- keywords/tags
This metadata helps users and systems quickly locate the document in a library, database, or search engine by matching the keywords to search queries.
[Note on Language: Excel does not allow you to specify language for specific Excel documents. Language can only be applied at the overall suite level.]
The file name is separate from the document’s title in the metadata. While the title helps describe the content internally, the file name is how the document is stored, located, and referenced on your computer. When saving an Excel file, choose a clear and concise file name. Avoid using extraneous special characters, as screen readers will read each of these characters aloud, which can be distracting and slow down navigation for users relying on assistive technologies.
Resources
On-Demand Training
As part of its effort to meet the Title II ADA Digital Accessibility requirements, UND has partnered with Deque University to provide an expansive selection of on-demand digital accessibility training modules to all UND employees. Explore accessibility in Microsoft Excel by taking the self-paced training, MS Excel Accessibility Techniques.