Accessible Tables
Characteristics of an Accessible Table
Tables are more than just a way to organize information; they are a powerful tool for sharing information clearly and effectively. When designed with accessibility in mind, tables become more user friendly for all—including individuals with disabilities. Some of the key characteristics of an accessible table include:
- Simple Structure: Design simple tables, avoiding merged or split cells.
- Consistent Header Row: Ensure header rows are consistent across pages. Rows should not break across pages.
- Descriptive Alternative Text: Add alternative text or a detailed description for more complex tables. This text should convey the same information to a user that the table would.
- Informative Table Caption or Summary: Include a caption or summary that explains the table's purpose prior to reading the table.
- Sufficient Color Contrast and Font Size: Use high color contrast combinations and font sizes.
- Keyboard-Friendly Navigation: Organize the table so users can move through it logically using keyboard controls.
Create Tables with Accessibility in Mind
Creating accessible tables requires careful planning and thoughtful design to ensure all users can understand and navigate your data.
When creating tables, follow these guidelines:
- Use tables for data only, not for layout purposes.
- Build all tables in the original document. Avoid drawing, importing, or inserting tables as an image file.
- Use a simple table structure with a clearly marked header row and first column.
- Avoid using blank, merged, and split cells. These can create issues for screen reader users, who may not be able to navigate the table in a logical reading order.
Table Header Row
A table header row is the top row of a table that serves as a title for the categories of information in each column. Designers often manually bold this row to create emphasis, but it's important to mark headers properly in the code to ensure they are structurally identified. Screen readers depend on these structural headers to help users understand the table's organization and navigate its content accurately
Table Header Row Example

Benefits of Table Header Rows?
Marking table headers tells screen readers users how to read tables. If the table headers have been properly marked, the user is able to navigate table cells and hear which column they are currently in.
Properly marked table headers benefit all users, not just those using screen readers. When tables span multiple pages, correctly marked headers ensure that readers can keep track of the table's structure without needing to flip back and forth between pages. This improves clarity and usability for everyone.
Table Header Row Guidelines
- Have only one header row per table.
- Have only one header column per table.
- Avoid title rows in the middle of a table. Instead, break up the table into two (or more) separate tables.
Alternative Text
Table Captions
Table captions provide a brief description of a table's content. Think of them as a quick summary of the table; they tell the reader the purpose of the table before diving into the details. It's important to know that captions are different from alternative text. Captions give a brief summary of the data, including where the data came from and/or who created the table. Meanwhile, alternative text is used to describe images in word for people who can't see them.
Color Contrast
Ensure that your tables and text meet a contrast ratio of at least 4.5:1 for regular text. For large text (18+ pt or 14+ pt bold), a minimum contrast ratio of 3:1 is acceptable. Use online contrast checkers like WebAIM to ensure compliance with accessibility standards.
Table Navigation
Accessible tables enable all users to navigate data smoothly using keyboard controls. A simple table layout is the best way to guide users through information smoothly. People should be able to navigate from left to right across rows and from top to bottom through columns without confusion. Clearly marked headers are especially important for people using screen readers, as they help explain how each piece of data connects to its row and column.
Building Tables
For guidance on how to build accessible tables in different softwares, review these steps.
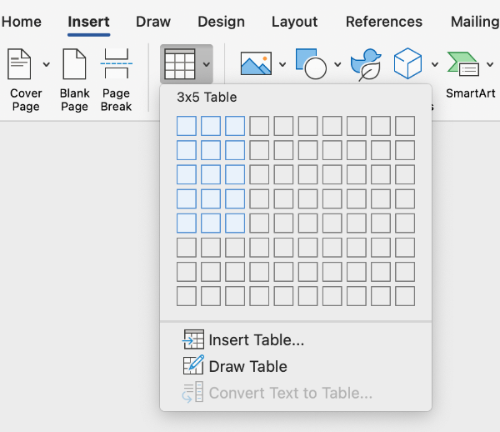
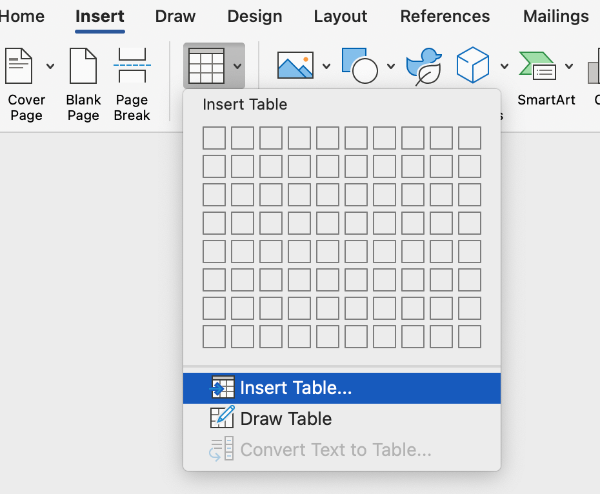
There are two ways to create a table in Microsoft Word. Both ways involve navigating to the Insert tab, where you will select the Table option.
The first way involves hovering over squares to specify table dimensions. In this example, I have hovered over squares indicating a 3x5 table (3 columns x 5 rows).
You may also choose to select the Insert Table option.
This will open an Insert Table editing pane. For this table, I have specified a 3x3 layout. You may also choose to manually specify column widths and how to treat cell data.
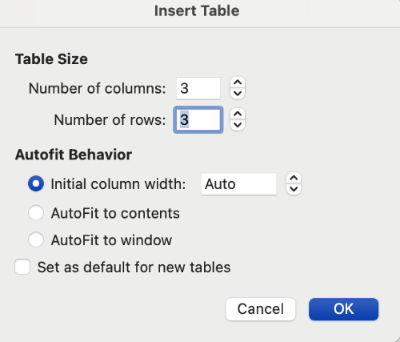
Table Header Row
To define the table header row in Word in a way that helps visual users as well as screen reader users, you will need to navigate to Table Properties.
Select your table by clicking on the selection icon at the top left corner of your table.
Right-click on the top row of the table and select Table Properties.
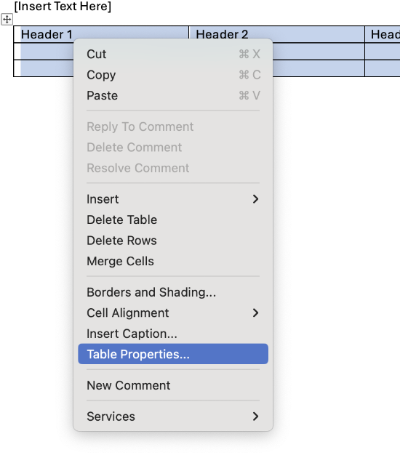
In the Table Properties dialog box, select the Row tab. Check the box beside Repeat as header row at the top of each page. Make sure you deselect Allow row to break across pages.
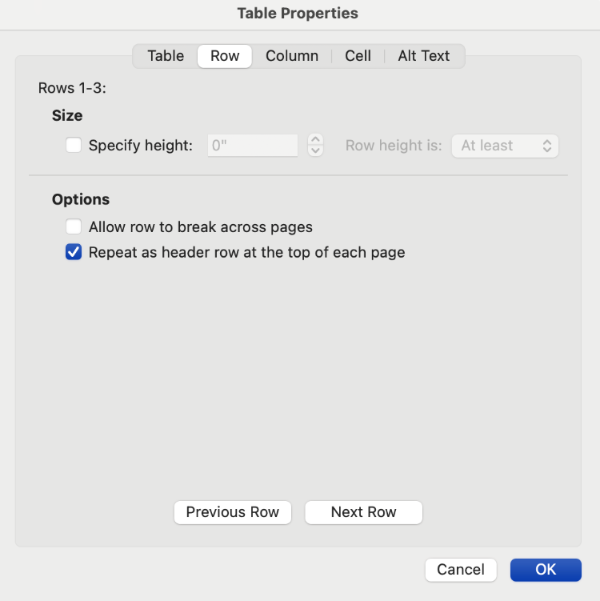
In addition to Table Properties, you will also need to make sure that the header row and/or column is set in the Table Design Tools.
Select the Design tab in the ribbon under Table Tools. Check the checkbox titled Header Row at the top left of the Design ribbon. If the table also has a header column, check the box titled First Column.

Resources
- Download a copy of TTaDA's tutorial Setting the Table Header Row in Microsoft Word.
- For more help, refer to Microsoft Office's support documentation on Inserting a Table and Creating Accessible Tables in Word.
Format Data As A Table
Excel organizes data into cells. If you already have data in your Excel worksheet, you can format this data using the Format as Table function.
To begin, select the top-left data cell of your intended table.
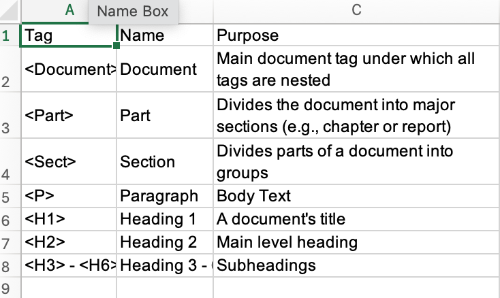
Navigate to the home tab and select Format as Table. Choose one of the pre-formatted table themes. You may also choose to create your own theme using the New Table Style option.
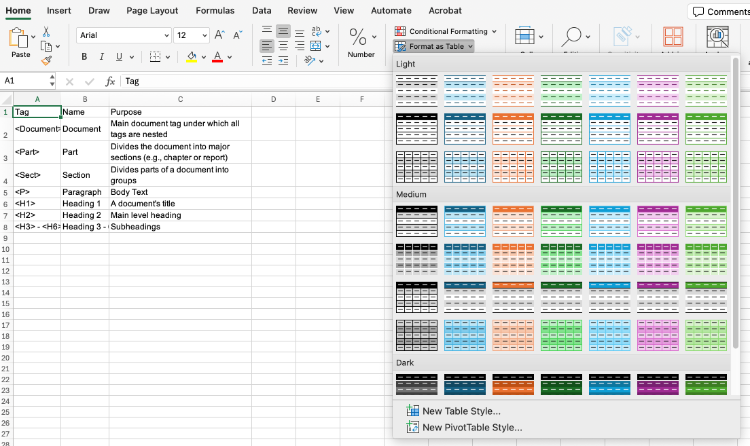
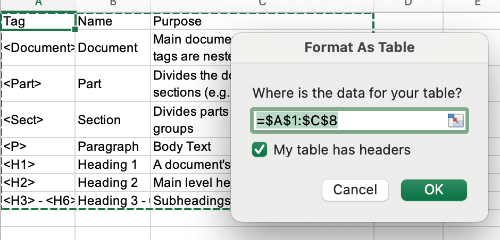
Once you have selected a theme, the Format as Table dialog box should open. Select My table has headers.
Then, navigate to the Table tab. Ensure that the Header Row option is selected. You may also choose to select the First Column option, if applicable.

Create Table
If no data has been entered into the Excel worksheet, you may choose to create a new data table.
Navigate to the Insert tab and select Table.

The Format as Table dialog box should open. Specify which cells you would like to add data to. Select My table has headers.
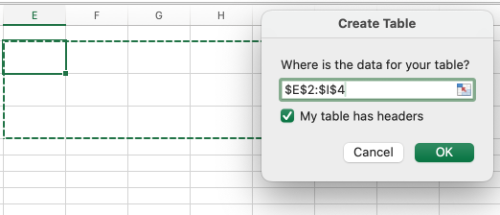
A pre-formatted blank table should appear. Ensure that the Header Row option is selected. You may also choose to select the First Column option if applicable.
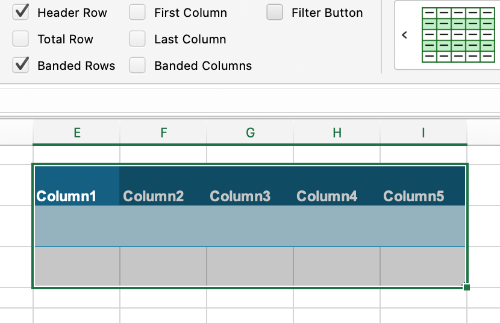
Now that the table has been created, you can begin inputting data into your table.
Resources
- Download a copy of TTaDA's tutorial Creating Accessible Tables in Excel.
- For more help, refer to Microsoft Office's support documentation on Creating and Formatting Tables in Excel.
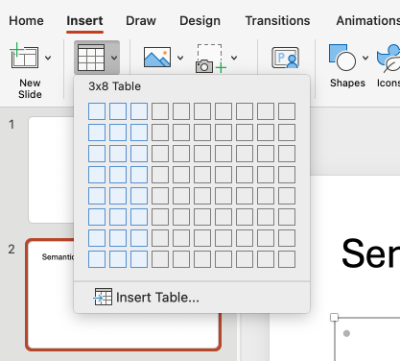
There are two ways to create a table in Microsoft PowerPoint. Both ways involve navigating to the Insert tab, where you will select the Table option.
The first way involves hovering over squares to specify table dimensions. In this example, I have hovered over squares indicating a 3x8 table (3 columns x 8 rows).
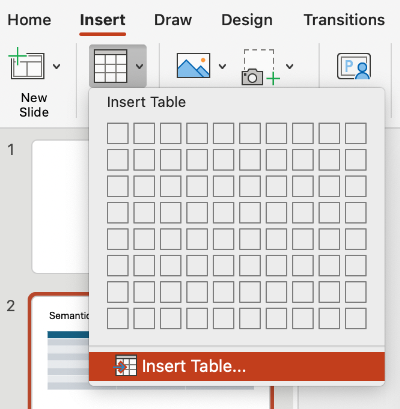
You may also choose to select the Insert Table option.
Navigate to the Table Design tab to ensure that the Header Row option is selected. You may also choose to select the First Column option, if applicable.

Next, you will type in your data.
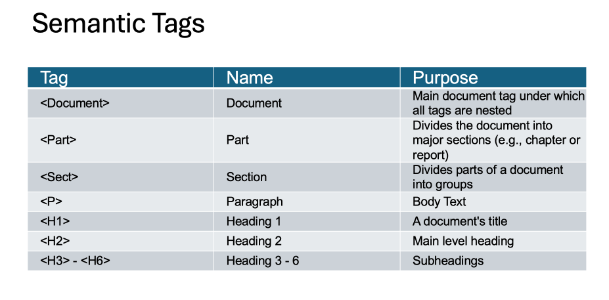
To change the table's style, you can navigate to the Table Design tab. Here, you can choose pre-formatted themes, customize colors and text, and add table effects.

To change the table's layout, you can navigate to the Table Layout tab. Here, you can add and delete rows and columns, format text, and change spacing options.

Resources
- Download a copy of TTaDA's tutorial Creating Accessible Tables in PowerPoint.
- For more help, refer to Microsoft Office's support documentation Adding Tables to PowerPoint Slides.
To add a table to a document in Blackboard Ultra, navigate to the content editor's text box. Select Create or Edit Table.
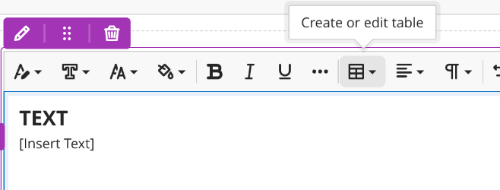
There are two ways to create a table in Blackboard, both using the Table editor tool.
- You can hover over squares to specify the table dimensions.
- You may also choose to select the Insert Table option.
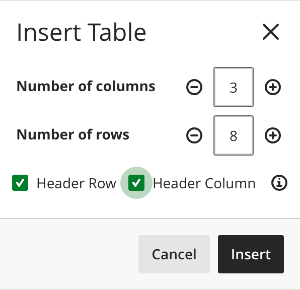
If you choose the Insert Table option, a dialog box opens. Here, you can specify the number of columns or rows you would like in your table. You should also specify if your table has a Header Row and/or Header Column.
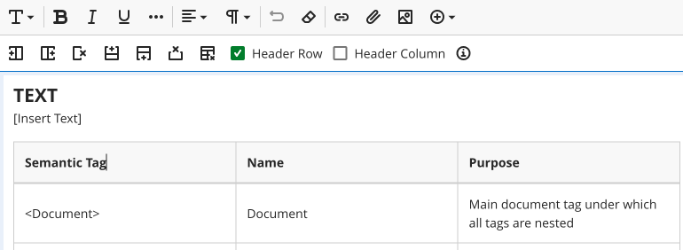
Once your table is created, you can begin to enter data. At this time, a Table editor ribbon will appear.
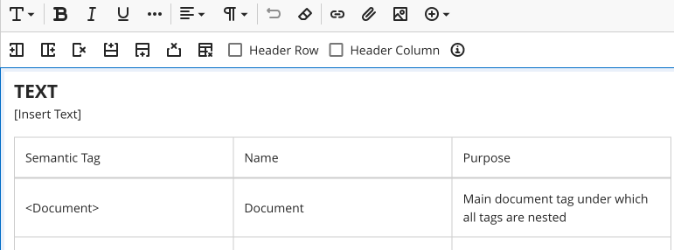
You must select if your table has a Header Row and/or Header Column in the Table editor ribbon. This will apply pre-set formatting options to your table.
Resources
- Download a copy of TTaDA's tutorial Creating Accessible Tables in Blackboard Ultra.
- For more help, refer to Blackboard's Help Center.
Resources
- Watch TTaDA's Introduction to Table Header Rows.
- Watch TTaDA's Introduction to Creating Table Header Rows in Blackboard Ultra.