Image Descriptions
When we use images in our course content, we often operate under the assumption that users can visually see and interpret the content in them. But, what happens when a student can’t see the image?
The "Image Problem"
In an educational context like ours, what happens if a student who can’t see has to answer a test question, complete an activity, or submit an assignment based off their understanding of that image?
Without an image description, our content design has set them up for failure.
In this scenario, some users may opt to use a screen reader, which is an assistive technology that converts digital content into spoken or braille output. Some common screen readers include:
- JAWS: most popular screen reader, available for download on Windows
- NVDA: free and available for download on Windows
- VoiceOver: integrated into MacOS and iOS
While screen readers can help blind or vision impaired users interact with digital content on a screen, they cannot describe the actual content within an image. When a screen reader encounters an image without a description, it merely announces “image” and moves on. This ultimately excludes screen reader users from engagement and learning. So, what is the solution? Content creators must provide image descriptions.
The "Image Solution": Image Descriptions
Image descriptions are written explanations that convey the content and function of an image for people who cannot see. They help ensure digital content is accessible to everyone, including those who use screen readers or have visual impairments. Depending on the complexity of the image, image descriptions may come in the form of alternative text or long descriptions.
| Alternative Text |
Alternative text (or alt-text) is the short, written description that typically appears in place of an image on a webpage or in a document. The purpose of alt-text is to textually describe a visual image in such a way that someone who can't see the image can understand that image's meaning. |
|---|---|
| Long Description |
Long descriptions provide a textual version of the essential information conveyed in a detailed or complex image. Long description is necessary when simple alternative text isn’t sufficient enough to capture an image's meaning. |
Simple Images
Simple images require alternative text. Alternative text is comprised of two parts:
- The HTML code
- A brief description of the image (alternative text)
The combination of these two parts enables screen readers to read aloud a description of the image, bridging the accessibility gap for blind or visually impaired learners.
Benefits of Alternative Text

Example image of how websites display broken images.
- For users with visual impairments, alt-text can be read aloud by screen readers. Note: if an image is complex, long description may be needed in addition to alt text.
- Written descriptions can help users process complex visual information by presenting it in multiple ways.
- Alt-text is available to search engines, increasing a website’s search engine optimization.
- It can be used for voice navigation on graphical links.
- When images don’t load, alt-text is displayed. This is particularly helpful when access to the internet is limited, and a broken image is displayed.
Guidelines for Writing Effective Alternative Text
Alternative text should be both concise and meaningful to the listener. It conveys the purpose of an image, not every detail. Consider the following when writing alt-text:
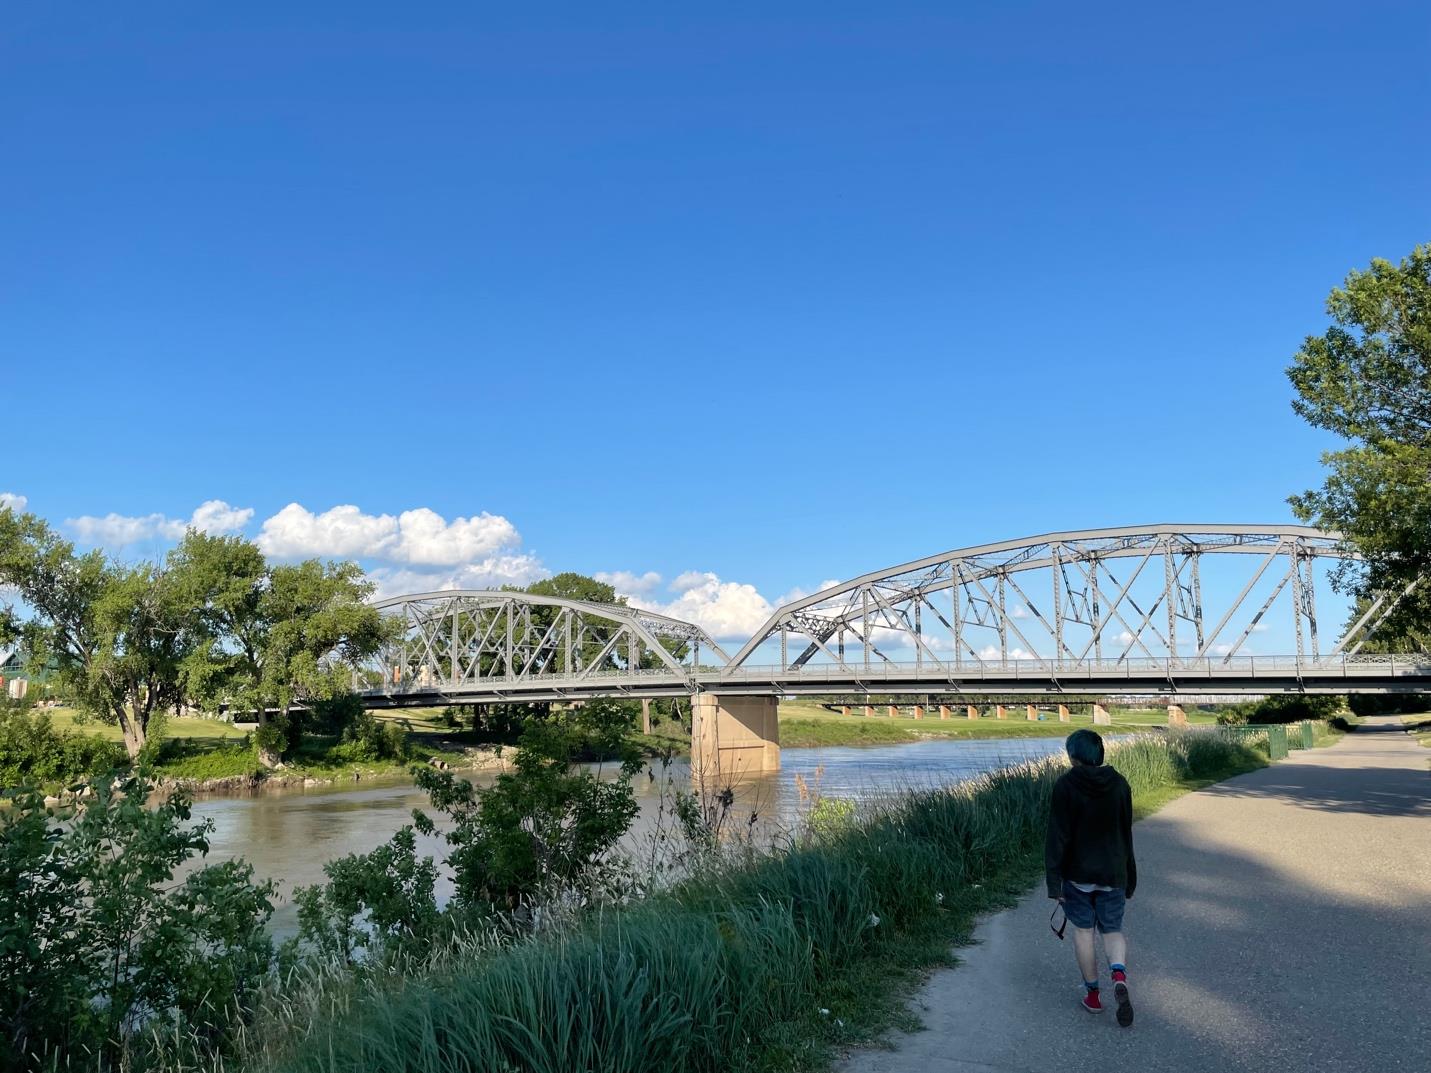
Sample Alternative Text: One of the bridges over the Red River in Grand Forks, ND. Behind the bridge is a brilliant blue sky with a few clouds hovering nearer the horizon. In the foreground, a person is walking along a path toward the bridge.
- Be concise – 120 characters max.
- Consider the target audience. How much knowledge do you expect the audience to have?
- If the image is also a link, the alt-text should describe the link target.
- If there is text in the image, include it in the alt-text.
- Avoid redundant statements like “Image of” or “This is a picture of.” A screen reader will already announce that it is an image.
- If the image is already described in the surrounding text, the alt-text can be very short.
- If an image is purely decorative, mark it as such.
- What is the context of the image? What meaning does it add to the page? Describe only what you expect visual users to get out of the image.
A Note About Automatic alt-text
In many cases, programs such as Microsoft Word or PowerPoint, will automatically generate alt-text for images, either using artificial intelligence, or inserting the filename or URL that the image originally came from. Automatically generated alt-text is, at best, only a guesstimate. At its worst, automatic alt text is actually more harmful than helpful. It's important to check alt-text manually to ensure that it offers a helpful description.
Complex Images
If an image can't be described in 120 characters or 1-2 sentences, it is probably a complex image. Thus, it will need a long description.
Some common examples of complex images include:
- Charts
- Graphs
- Infographics
- Cartoons
- Smart Art
- Flowcharts
- Maps
- Illustrations
The Two-Part Approach to Complex Images
Even though your long description provides the actual description of the image, you still need to alert screen readers to the image. You also need to ensure that users can make the connections between the image in the original location and the long description. To do this, a two-part text approach is needed. The first part will include a brief snippet of alt-text, identifying the image and (when necessary) the location of the long description. The second part will consist of the long description.
Check out the example below that shows how to make the connection:
- Alt Text: “Chart 1.2: Long Description is located in Appendix A."
- Long Description: “Chart 1.2 suggests that…” (in Appendix A)
Make Complex Images Accessible
To make a complex image accessible, you should:
- Use a static, flattened image: do not embed graphs or interactive charts in your document, as these often exist on separate drawing layers that are not accessible to screen reader users. Instead, take a screenshot of the chart or graph, and use that image. The image should be a single, non-interactive object.
- Add a descriptive caption: include an image ID and a brief explanation of what the image shows (e.g., Figure 1: Map of Greece or Table 3: Revenue Growth in Quarter 3).
- Provide alternative text: this text should be short and formulaic. Reference the image ID, and direct users to where the long description can be found (e.g., Figure 1. See below for detailed description).
- Provide a detailed long description: this should convey all meaningful content and relationships shown in an image.
Preparing Your Long Description
Some options to support complex image accessibility include:
- Paragraph(s) of text: these should ideally be positioned close to the image (either above or below the image in a Word document OR on the same slide or next slide in a PowerPoint presentation)
- A simple table: sometimes, slightly more complex bar or pie chart data can be presented in a simple table format
- A list of data points: sometimes, slightly more complex bar or pie chart data can be presented in a list format
- Video content: if you have described the image in full detail in a lecture video – and please note that you must describe the image in full – you can indicate the title of the video and exact timestamp where the description begins
- Appendices, Notes, or external websites: You can link to any of these that are appropriate and that your audience will have access to in the body of your text – just remember, you can’t add links to alt-text
Because long description is rather lengthy and detailed, it can’t be put into alt-text fields. Instead, you’ll need to decide where to put it. You have several options:
- In the surrounding text or slides
- In an appendix or appendix slide
- In the speaker notes (PPT)
- In an attached video
- On an external site that has been linked
- Identify the type of image in the first sentence. Knowing what type of image (cartoon, bar graph, pie chart, diagram, illustration) is being described is essential for comprehension.
- Summarize the point of the image in your second sentence. Identifying the overall point of the information being presented provides important context and direction.
- Use spatial references. What is on the right side of the image? In the top corner? Left side of the image? Lower bottom quadrant?
- Use x- and y-axis. If you are working with a chart or a graph that uses a x- and y-axis, identify what each axis measures.
For more practice on writing and formatting long descriptions, see the Guide to Creating Accessible Complex Images Using Appendices and Internal Links.
Then, edit this Sample Document with Complex Images for accessibility. How can we make these images accessible?
Image Guide
Are you looking for a resource to help you get started writing image descriptions? Download the Image Guide for sample alternative text and long descriptions for a variety of image types. This guide is designed to help you get started in writing image descriptions while providing ideas for how images can be described in different contexts.
Because images vary widely in purpose and complexity, this guide should be used as a reference rather than a template.
Add Image Descriptions in...
Resources
Recorded Workshops
- Watch TTaDA's pre-recorded workshop on Introduction to Accessible Simple Images.
- Watch TTaDA's pre-recorded workshop on Creating Accessible Complex Images.